. 2014 Apr;42(8):4868-81.
doi: 10.1093/nar/gku135. Epub 2014 Feb 11.

Bimodal high-affinity association of Brd4 with murine leukemia virus integrase and mononucleosomes

Affiliations

Bimodal high-affinity association of Brd4 with murine leukemia virus integrase and mononucleosomes

Ross C Larue et al. Nucleic Acids Res. 2014 Apr.

Abstract

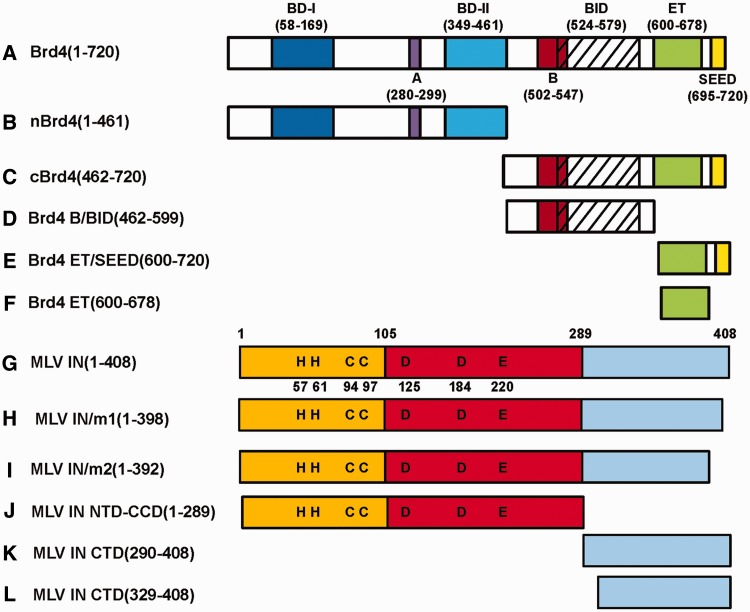
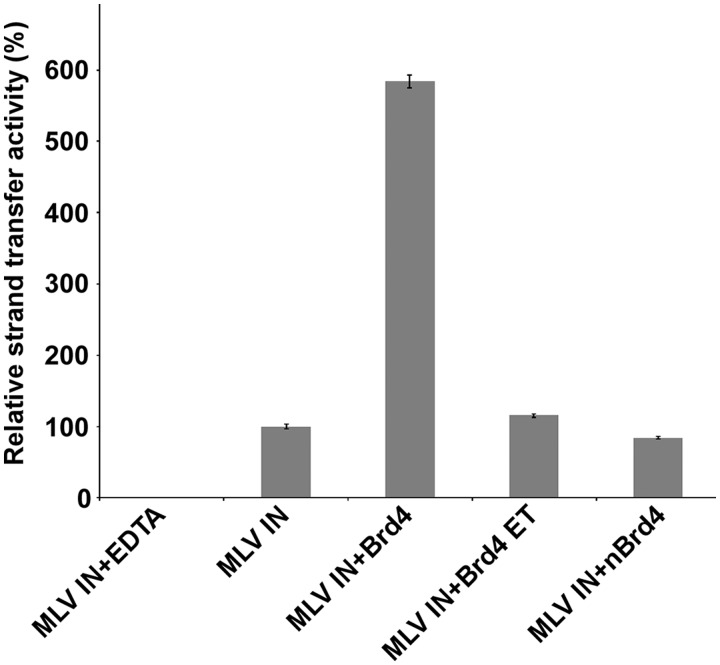
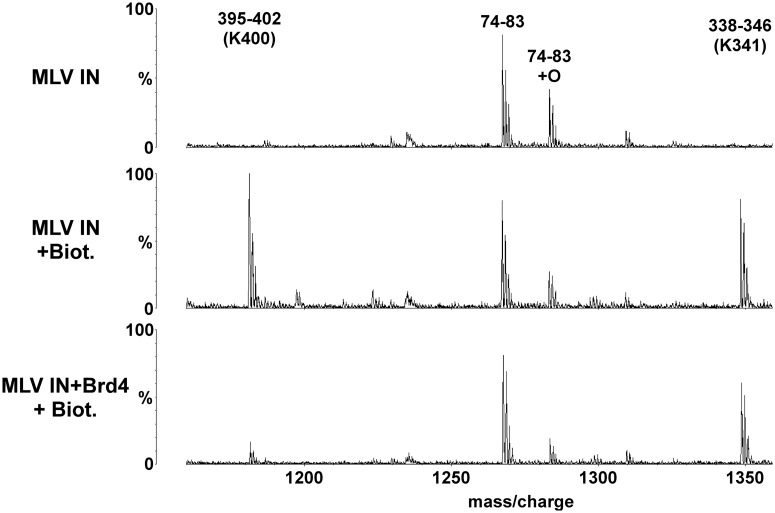
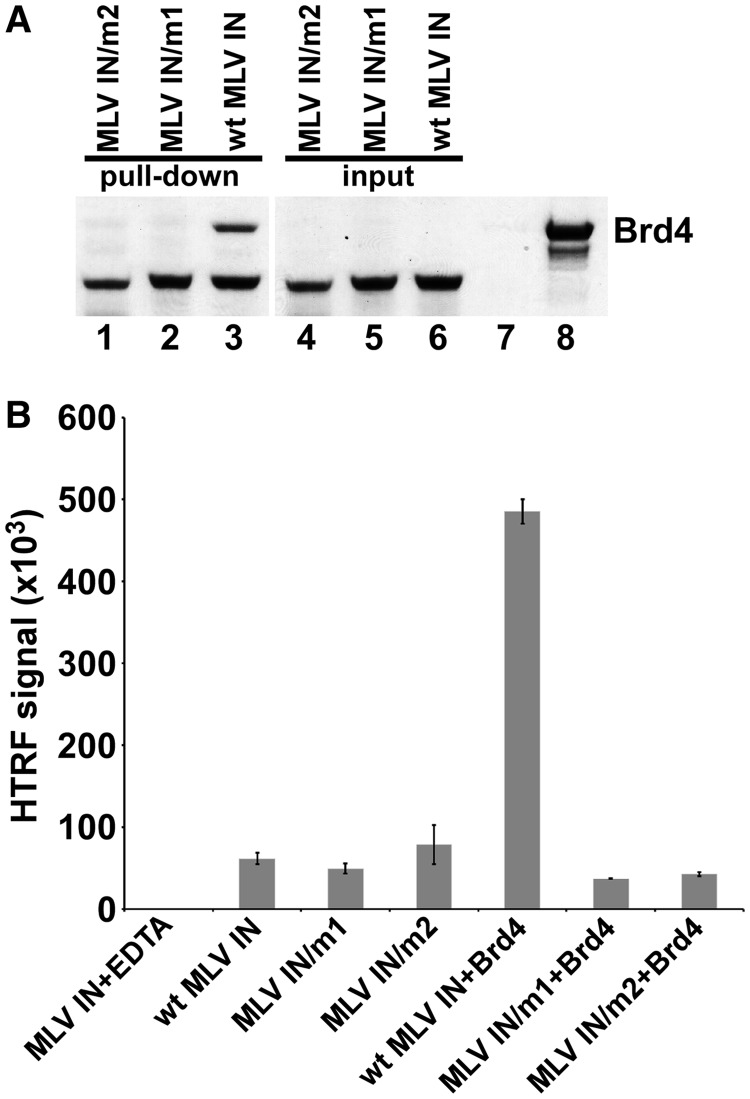
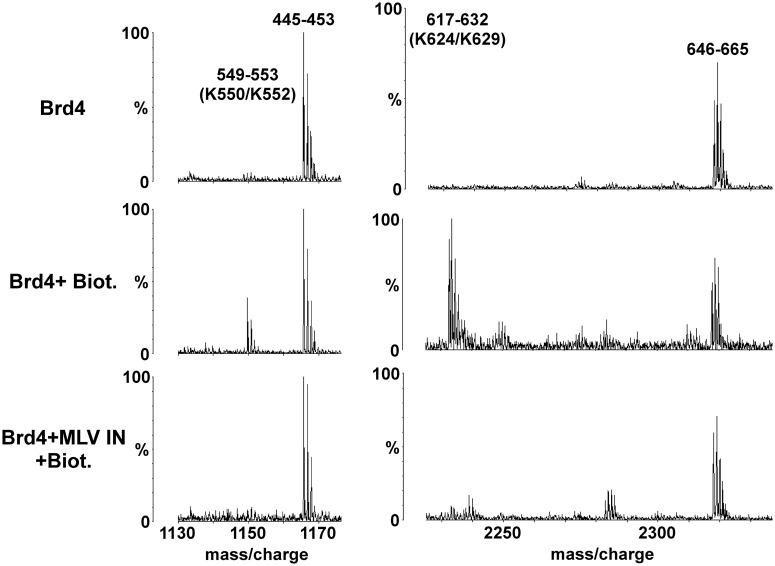
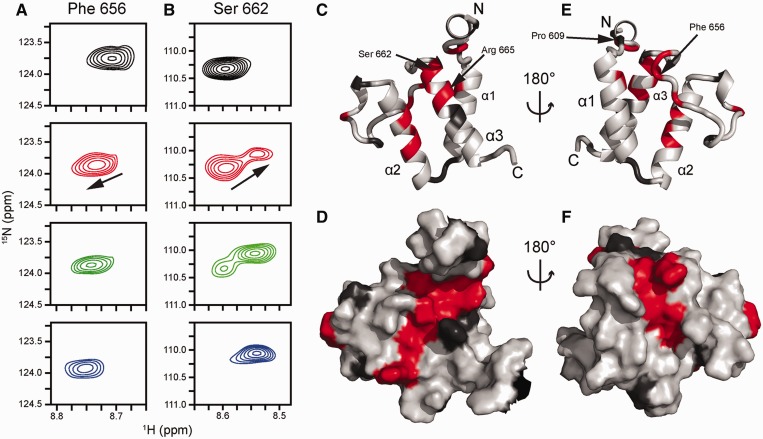
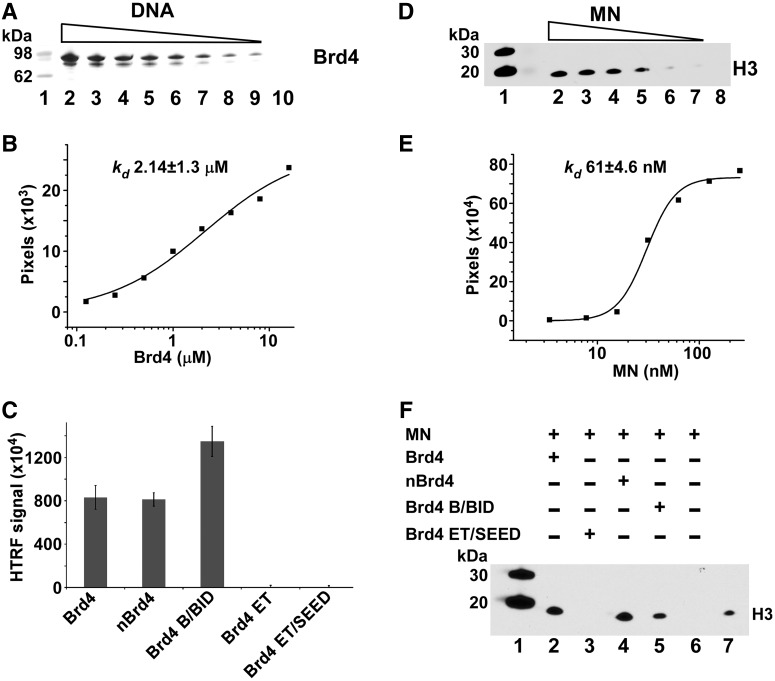
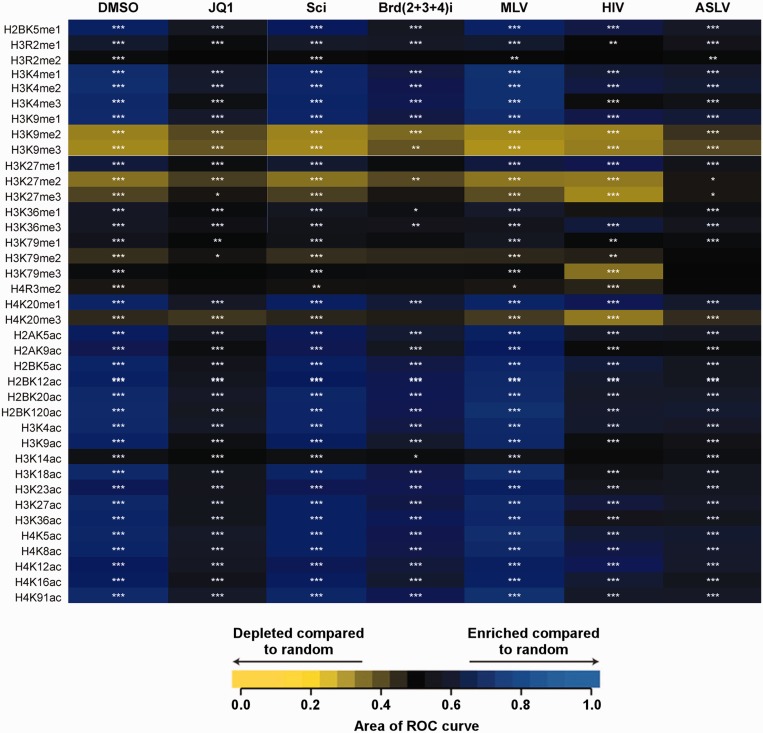
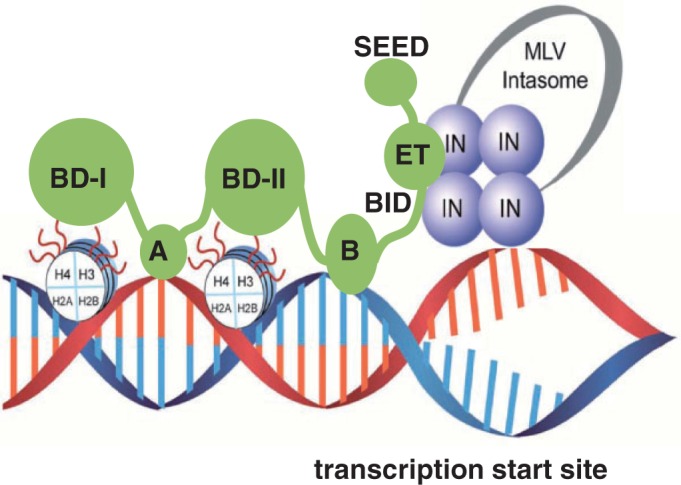
The importance of understanding the molecular mechanisms of murine leukemia virus (MLV) integration into host chromatin is highlighted by the development of MLV-based vectors for human gene-therapy. We have recently identified BET proteins (Brd2, 3 and 4) as the main cellular binding partners of MLV integrase (IN) and demonstrated their significance for effective MLV integration at transcription start sites. Here we show that recombinant Brd4, a representative of the three BET proteins, establishes complementary high-affinity interactions with MLV IN and mononucleosomes (MNs). Brd4(1-720) but not its N- or C-terminal fragments effectively stimulate MLV IN strand transfer activities in vitro. Mass spectrometry- and NMR-based approaches have enabled us to map key interacting interfaces between the C-terminal domain of BRD4 and the C-terminal tail of MLV IN. Additionally, the N-terminal fragment of Brd4 binds to both DNA and acetylated histone peptides, allowing it to bind tightly to MNs. Comparative analyses of the distributions of various histone marks along chromatin revealed significant positive correlations between H3- and H4-acetylated histones, BET protein-binding sites and MLV-integration sites. Our findings reveal a bimodal mechanism for BET protein-mediated MLV integration into select chromatin locations.


Figures

Figure 1.
Figure 1.
Brd4 and MLV IN constructs used in the present study. All Brd4 constructs (AF) contained the N-terminal hexa-histidine tag, whereas MLV IN proteins (GL) contained either GST- or hexa-histidine tag at their N-terminus.
Figure 2.
Figure 2.
Effects of Brd4(1–720), nBrd4 and Brd4 ET on MLV IN strand transfer activities. HTRF-based strand-transfer assays (21) were performed for accurate quantitative and comparative analyses with HTRF signals plotted. Where indicated 0.5 µM 6xHis–Brd4(1–720), 6xHisn–Brd4(1–461) or 6xHis–Brd4 ET(600–678) was added to the reaction containing 0.3 µM GST–MLV IN. As a control, 50 mM EDTA was added to a reaction containing both 6xHis–Brd4(1–720) and GST–MLV IN. Bars represent means ± SD [n = 3].
Figure 3.
Figure 3.
MS-based footprinting of MLV IN interface interacting with Brd4. Representative sections of MALDI-ToF spectra of tryptic peptides of GST–MLV IN are shown. Conditions are indicated to the left with the top profile: GST–MLV IN alone; the middle profile: GST–MLV IN plus treatment with 1 mM NHS-biotin; and the bottom profile: GST–MLV IN preincubated with 6xHis–Brd4(1–720) and then treated with 1 mM NHS-biotin. The start and end amino acid numbers for each identified peak is shown. The Lys residues affected by NHS-biotin modification are indicated in brackets. Also shown are peaks of peptides (74–83) whose intensities do not vary as they do not contain any modified lysine residues allowing them to serve as internal controls.
Figure 4.
Figure 4.
Analysis of MLV IN/m1 and MLV IN/m2. (A) Binding of wild type and mutant MLV INs to Brd4. GST-tagged MLV IN/m2 (lane 1), GST-tagged MLV IN/m1 (lane 2) and wild-type MLV IN (lane 3) were used to pull-down 6xHis–Brd4(1–720). Lanes 4–6 show input of mutant and wild-type MLV INs. Lane 7: pull-down of 6xHis–Brd4 in the absence of MLV IN. Lane 8: input of 6xHis–Brd4. (B) Comparative HTRF-based strand-transfer activities of wild-type and mutant MLV INs in the presence and absence of 0.5 µM 6xHis–Brd4. As a control, 50 mM EDTA was added to a reaction containing both 6xHis–Brd4 and GST–MLV IN. Bars represent means ± SD [n = 3].
Figure 5.
Figure 5.
MS-based analyses of interacting interface of Brd4 with MLV IN. Representative sections of MALDI-ToF data for tryptic peptides of 6xHis–Brd4(1–720) are shown. Modification conditions are indicated to the left with the top profile: 6xHis–Brd4(1–720) alone; the middle profile: 6xHis–Brd4(1–720) plus 1 mM NHS-biotin; and the bottom profile: 6xHis–Brd4(1–720) preincubated with GST–MLV IN and then treated with 1 mM NHS-biotin. The peaks are indicated by their start and end amino acid numbers. The Lys residues modified by NHS-biotin are indicated in brackets. Also shown are peaks of peptides (445–453 and 646–665) whose intensities do not vary as they do not contain any modified lysine residues allowing them to serve as internal controls.
Figure 6.
Figure 6.
Perturbation of amide NMR signals of Brd4 ET upon titration with MLV IN CTD. (A) Amide resonance from F656, which exhibits fast exchange and averaging between the free and bound chemical shifts. (B) Amide resonances from S662. This signal exemplifies the slow exchange regime, which is characterized by slow disappearance of the free peak coupled to the appearance of the bound peak. Top (black) spectra, unliganded Brd4 ET; second row (red), Brd4 ET with 0.5 equivalents of MLV CTD; third row (green), Brd4 ET with 1 equivalent of MLV CTD; bottom row (blue), Brd4 ET with 1.5 equivalents of MLV CTD. The black arrow indicates the direction of the CSP from the unliganded to the bound state. Resonance assignments are as previously reported (38). CSPs mapped onto the cartoon (C) and surface (D) views of the Brd4 ET structure (PDBID: 2JNS) (38) to demonstrate a putative MLV IN-binding interface. Light grey coloring indicates residues whose backbone amide CSP (Supplementary Figure S2) is <0.02 ppm. Dark grey coloring indicates residues with no data either due to being proline or spectral overlap. Red coloring indicates residues whose backbone amide CSP (Supplementary Figure S2) being >0.02 ppm due to MLV IN binding to Brd4 ET which include residues 607, 608, 615, 632, 633, 634, 636, 646, 654, 655, 656, 657, 662, 663, 665, 666 and 667. Specific residues are highlighted for reference.
Figure 7.
Figure 7.
Brd4 interactions with DNA (A, B and C) and MNs (D, E and F). (A) Streptavidin linked sepharose bead-based pull-downs of decreasing concentrations (lanes 2–9) of purified recombinant 6xHis–Brd4(1–720) with biotinylated 40-bp DNA were separated by SDS-PAGE and visualized by Coomassie Blue staining. The control to rule out non-specific binding is shown with 125 nM 6xHis–Brd4(1–720) minus biotinlyated DNA (lane 10). Molecular weight markers are in lane 1. (B) Experiments were run in triplicate with very similar results with a graphical representation of one gel shown to determine an apparent binding Kd. The intensities of 6xHis–Brd4(1–720) bound to biotinlyated DNA were quantified using ImageJ software and data were fit to the Hill equation. (C) Interactions of indicated Brd4 domains with the biotinylated DNA were measured by the HTRF-based assay. Reactions were run in triplicate with bars representing standard deviations. (D) Nickel bead-based pull-down of purified native MNs with recombinant 6xHis–Brd4(1–720) and immunoblotting with H3 antibodies. A gradient of decreasing MNs (lanes 2–7) was run. Control pull-down is shown with 125 nM MNs without 6xHis–Brd4(1–720) (lane 8) to rule out non-specific binding to nickel beads. Native MNs contain naturally occurring histone modifications and cellular genomic DNA. (E) Graphical representation of immunoblot is also shown to determine an apparent binding Kd. The intensities of H3 bands were quantified using ImageJ software and data were fit to the Hill equation. (F) Nickel bead-based pull-down reactions with indicated fragments of 6xHis–Brd4 and MNs. Bound MNs were detected by immunoblotting with anti-H3 antibody.
Figure 8.
Figure 8.
Heatmap summarizing integration frequencies relative to histone post-translational modifications. Integration site datasets are shown in the columns. Histone post-translational modifications are shown in the rows and labeled on the left. The receiver operator characteristic (ROC) curve area method was used to quantify the relationship between the integration site frequencies relative to matched random controls for each of the annotated histone post-translational modification shown on the left. The color key depicts enrichment or depletion of the annotated feature-near integration sites (enrichment is indicated in blue and depletion is indicated in yellow; intensity of the color indicates the strength of the effect). P-values are for individual integration site datasets compared to matched random controls, ***P < 0.001; **P < 0.01; *P <0.05. ‘JQ-1’ indicates 500 nM JQ-1 inhibitor treatment, ‘Sci’ indicates scrambled control siRNA knockdown, ‘Brd(2+3+4)I’ indicates siRNA knockdown of all three BET proteins.
Figure 9.
Figure 9.
Schematic diagram showing the bimodal mechanism of BET proteins mediated tethering of MLV intasome to select chromatin sites. BET proteins associate with nucleosomes through interactions of BD-I and II with cognate modified H3 and H4 tails as well as motifs A and B binding directly to DNA. The ET domain in the BET proteins directly engages the C-terminal tail of MLV IN to target MLV integration near transcription start sites.

Similar articles

Cited by

References

    1. Schroder AR, Shinn P, Chen H, Berry C, Ecker JR, Bushman F. HIV-1 integration in the human genome favors active genes and local hotspots. Cell. 2002;110:521–529. - PubMed
    1. Wu X, Li Y, Crise B, Burgess SM. Transcription start regions in the human genome are favored targets for MLV integration. Science. 2003;300:1749–1751. - PubMed
    1. Lewinski MK, Yamashita M, Emerman M, Ciuffi A, Marshall H, Crawford G, Collins F, Shinn P, Leipzig J, Hannenhalli S, et al. Retroviral DNA integration: viral and cellular determinants of target-site selection. PLoS Pathog. 2006;2:e60. - PMC - PubMed
    1. Cherepanov P, Maertens G, Proost P, Devreese B, Van Beeumen J, Engelborghs Y, De Clercq E, Debyser Z. HIV-1 integrase forms stable tetramers and associates with LEDGF/p75 protein in human cells. J. Biol. Chem. 2003;278:372–381. - PubMed
    1. Ciuffi A, Llano M, Poeschla E, Hoffmann C, Leipzig J, Shinn P, Ecker JR, Bushman F. A role for LEDGF/p75 in targeting HIV DNA integration. Nat. Med. 2005;11:1287–1289. - PubMed

Publication types