. 2014 Feb 25;111(8):3128-33.
doi: 10.1073/pnas.1316793111. Epub 2014 Feb 11.

Functional epigenetics approach identifies BRM/SMARCA2 as a critical synthetic lethal target in BRG1-deficient cancers

Affiliations

Functional epigenetics approach identifies BRM/SMARCA2 as a critical synthetic lethal target in BRG1-deficient cancers

Gregory R Hoffman et al. Proc Natl Acad Sci U S A. .

Abstract

Defects in epigenetic regulation play a fundamental role in the development of cancer, and epigenetic regulators have recently emerged as promising therapeutic candidates. We therefore set out to systematically interrogate epigenetic cancer dependencies by screening an epigenome-focused deep-coverage design shRNA (DECODER) library across 58 cancer cell lines. This screen identified BRM/SMARCA2, a DNA-dependent ATPase of the mammalian SWI/SNF (mSWI/SNF) chromatin remodeling complex, as being essential for the growth of tumor cells that harbor loss of function mutations in BRG1/SMARCA4. Depletion of BRM in BRG1-deficient cancer cells leads to a cell cycle arrest, induction of senescence, and increased levels of global H3K9me3. We further demonstrate the selective dependency of BRG1-mutant tumors on BRM in vivo. Genetic alterations of the mSWI/SNF chromatin remodeling complexes are the most frequent among chromatin regulators in cancers, with BRG1/SMARCA4 mutations occurring in ∼10-15% of lung adenocarcinomas. Our findings position BRM as an attractive therapeutic target for BRG1 mutated cancers. Because BRG1 and BRM function as mutually exclusive catalytic subunits of the mSWI/SNF complex, we propose that such synthetic lethality may be explained by paralog insufficiency, in which loss of one family member unveils critical dependence on paralogous subunits. This concept of "cancer-selective paralog dependency" may provide a more general strategy for targeting other tumor suppressor lesions/complexes with paralogous subunits.


Conflict of interest statement

The authors declare no conflict of interest.

Figures

Fig. 1.
Fig. 1.
An epigenome-wide pooled shRNA screen identifies BRM as a synthetic lethal target in BRG1-mutant cancer cells. (A) A schematic of the screening workflow for the shRNA screens. (B) Scatter plot showing the normalized counts for each shRNA in the epigenome shRNA library in the original plasmid pool plotted relative to a sample taken after five-population doublings from a KRAS-mutant pancreatic cancer cell line Mia-Paca-2. The 17 shRNAs targeting KRAS are highlighted in purple, illustrating the loss in representation for the majority of KRAS shRNAs during the time course of the experiment. The solid line is drawn to indicate no change in counts, whereas the dotted lines indicated ±1.5-fold change in counts. (C) Ranking for all elements in the epigenome shRNA library are shown highlighting BRM as the top-ranking hit from the screen. Ranks were calculated for each gene from the library based on the difference in the mean log P value calculated by using the RSA statistic for sensitive cell lines relative to insensitive cell lines. The rank for KRAS is highlighted to illustrate the performance of a positive control that selectively inhibits growth in KRAS-mutant cell lines.
Fig. 2.
Fig. 2.
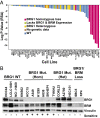
Complete loss of BRG1 and retention of BRM define the growth inhibitory response of cancer cells to BRM-targeting shRNAs. (A) Waterfall plot showing the log P value calculated with the RSA statistic for BRM shRNAs as in Fig. 1C and colored by BRG1 mutation status (i.e., homozygous, heterozygous, dual loss of BRG1/BRM). (B) Western blot of representative BRG1-WT and mutant cell lines from the screen showing BRG1 and BRM expression. VINCULIN is included as a loading control. BRG1-WT cell lines retain BRG1 expression, whereas BRG1 homozygous mutant cell lines sensitive to BRM shRNAs (denoted as +) lack BRG1 expression but retain BRM expression.
Fig. 3.
Fig. 3.
BRM depletion significantly and selectively inhibits the growth of BRG1-mutant cancer cells. (A) Western blot showing reduction of BRM protein upon dox treatment (120 h, 100 ng/mL) of BRG1-mutant/deficient NCI-H838 cells stably transduced with inducible BRM shRNA-2025 or 5537. A nontargeting CTL shRNA was included. (B) Western blot as in A but in BRG1-WT NCI-H460 cells. (C) CTL or BRM shRNA NCI-H838 cells were seeded at 500 cells per well in a 96-well plate in triplicate. Cells were treated with dox, and cell growth was measured by using the cell titer glo assay at the indicated times. All assays were performed in triplicate, and values are shown as mean ± SD. (D) Cell growth assay as in D but with CTL or BRM shRNA NCI-H460 cells. (E) CTL or BRM shRNA NCI-H838 cells were seeded at 2,000 cells per well. Cells were treated with dox (100 ng/mL), and colony formation was monitored after 11 d with crystal violet staining. (F) CTL or BRM shRNA NCI-H460 cells were seeded at 1,000 per well, treated with dox, and monitored for colony formation as in E.
Fig. 4.
Fig. 4.
Dual but not sole BRG1 and BRM knockdown inhibits the growth of BRG1 WT cells. (A) Western blot for BRG1 and BRM levels in lysates from CTL shRNA, BRG1 shRNA-2202, BRM shRNA-2025, or dual (BRG1 shRNA-2202 and BRM shRNA-2025) shRNA containing BEAS2B cells (nontransformed/ immortalized) that were treated for 3 d with or without dox. β-Actin was used a loading control. (B) CTL, BRG1 shRNA2202, BRM shRNA-2025, or dual (BRG1 shRNA-2202 and BRM shRNA-2025) shRNA containing BEAS2B cells were seeded at 500 cells per well and treated with or without dox for 10 d. Colony formation was monitored with crystal violet staining. (C) Western blot for BRG1 and BRM levels in lysates from CTL shRNA, BRG1 shRNA-2202, BRM shRNA-2025, or dual (BRG1 shRNA-2202 and BRM shRNA-2025) shRNA containing BRG1 WT NCI-H460 lung cancer cells that were treated for 3 d with or without dox. β-Tubulin was used a loading control. (D) CTL, BRG1 shRNA-2202, BRM shRNA-2025, or dual (BRG1 shRNA-2202 and BRM shRNA-2025) shRNA containing BRG1 WT NCI-H460 lung cancer cells were seeded in six-well plates and treated for 11 or 16 d with or without dox. Cell number was quantified by a Trypan blue exclusion assay and normalized to the –dox sample for each cell line. Experiment shown is representative of three independent experiments.
Fig. 5.
Fig. 5.
BRM knockdown does not perturb the interaction of core mSWI/SNF subunits, and leads to a cell cycle arrest and senescence, accompanied by induction of H3K9me3. (A) Western blot showing detection of mSWI/SNF subunits upon immunoprecipitation of the core subunit BAF155 or SNF5, in the absence and presence of dox-induced BRM knockdown in a BRG1-mutant cell line, NCI-H838. (B) BRM shRNA-2025 containing NCI-H838 cells were treated with or without dox for 7 d and assessed for changes in cell cycle by analysis of DNA content via Propidium Iodide staining. Percentage of cells displaying G1, S, and G2 phase content are shown on each histogram. (C) CTL shRNA or BRM shRNA containing NCI-H838 cells were induced with dox for 7 d and monitored for senescence-associated β-galactosidase staining (blue precipitate). (D) CTL shRNA or BRM shRNA containing NCI-H838 cells were induced with dox for 7 d and stained for H3K9me3 and DAPI.
Fig. 6.
Fig. 6.
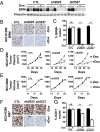
BRM knockdown inhibits the growth of BRG1-mutant tumors in vivo. NCI-H1299 cancer cells stably expressing dox-inducible CTL shRNA or two distinct BRM-targeting shRNAs (sh2025 or sh5537) were inoculated into mice. Tumor-bearing mice were treated for with either vehicle or dox. (A) Western blot of tumor BRM and VINCULIN (loading control) after 7 d of treatment. (B) Representative images of BRM IHC staining after 7 d of treatment. (C) Percentage of nuclei positive for BRM after 7 d of treatment. Graphs represent mean ± SEM (n = 3 per treatment group). (D and E) NCI-H1299 (D) or NCI-H460 (E) cancer cells stably expressing dox-inducible CTL, sh2025, or sh5537 BRM shRNA were inoculated into mice. When tumor volume reached 100–300 mm3, mice were treated continuously with either vehicle diet (black circles) or dox-supplemented diet (white circles). The tumor volume of vehicle and dox-treated mice is plotted as the mean ± SEM (n = 8 per treatment group). *P < 0.05 of Δ tumor volume for the dox relative to vehicle-treated group. (F) Representative images of Ki67 IHC staining of NCI-H1299 tumors after 7-d treatment. (G) Percentage of nuclei positive for Ki67 in NCI-H1299 tumors after 7 d of treatment. Graphs represent mean ± SEM (n = 3 per treatment group).

References

    1. You JS, Jones PA. Cancer genetics and epigenetics: Two sides of the same coin? Cancer Cell. 2012;22(1):9–20. - PMC - PubMed
    1. Kadoch C, et al. Proteomic and bioinformatic analysis of mammalian SWI/SNF complexes identifies extensive roles in human malignancy. Nat Genet. 2013;45(6):592–601. - PMC - PubMed
    1. Shain AH, Pollack JR. The spectrum of SWI/SNF mutations, ubiquitous in human cancers. PLoS ONE. 2013;8(1):e55119. - PMC - PubMed
    1. Wilson BG, Roberts CW. SWI/SNF nucleosome remodellers and cancer. Nat Rev Cancer. 2011;11(7):481–492. - PubMed
    1. Dykhuizen EC, et al. BAF complexes facilitate decatenation of DNA by topoisomerase IIα. Nature. 2013;497(7451):624–627. - PMC - PubMed

MeSH terms