. 2014 Feb 10;9(2):e88672.
doi: 10.1371/journal.pone.0088672. eCollection 2014.

Endocannabinoid modulation of cortical up-states and NREM sleep

Affiliations

Endocannabinoid modulation of cortical up-states and NREM sleep

Matthew J Pava et al. PLoS One. .

Abstract

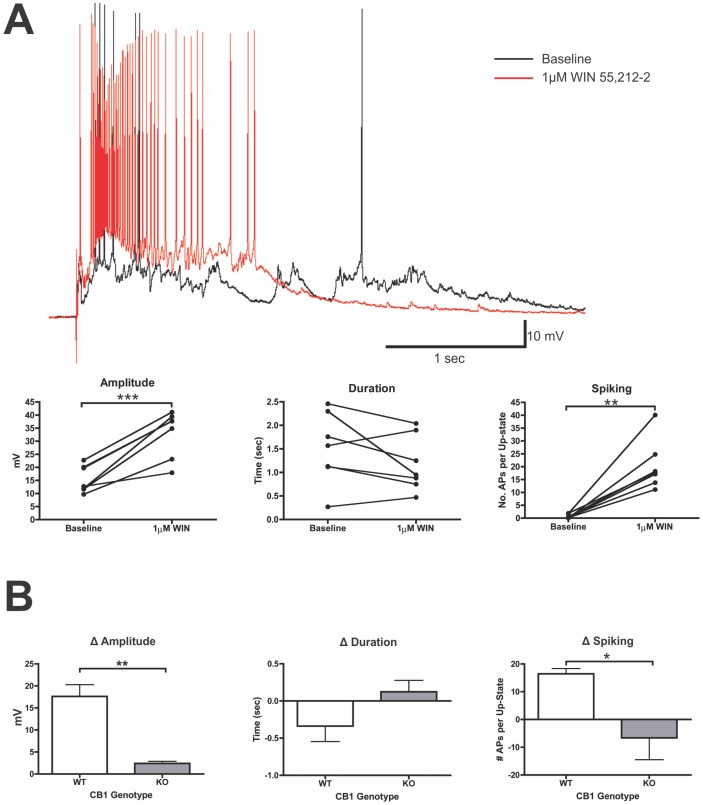
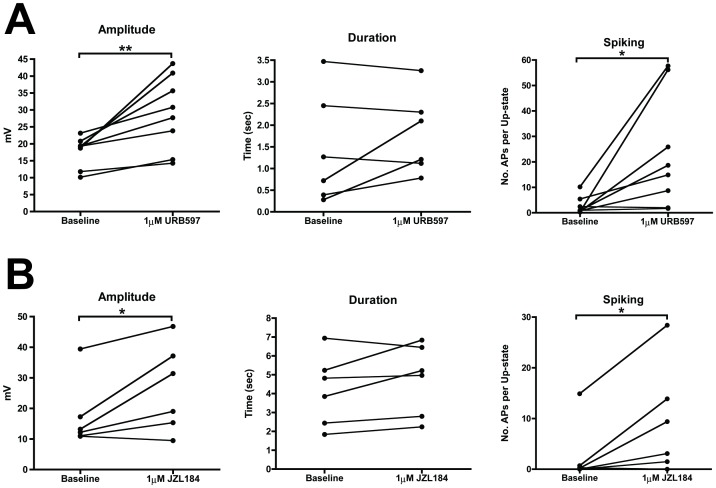
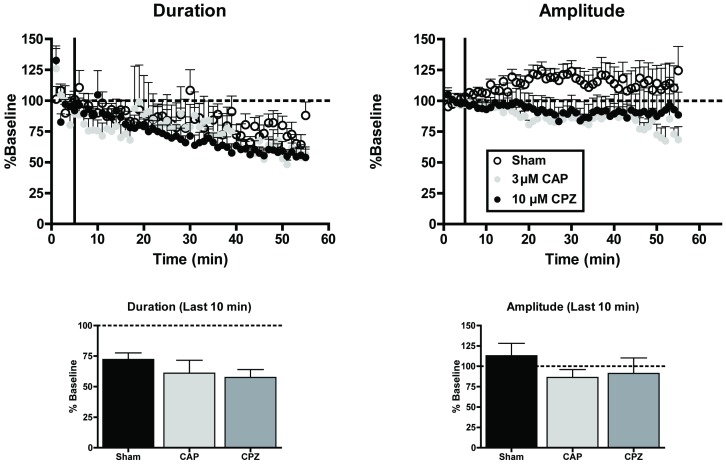
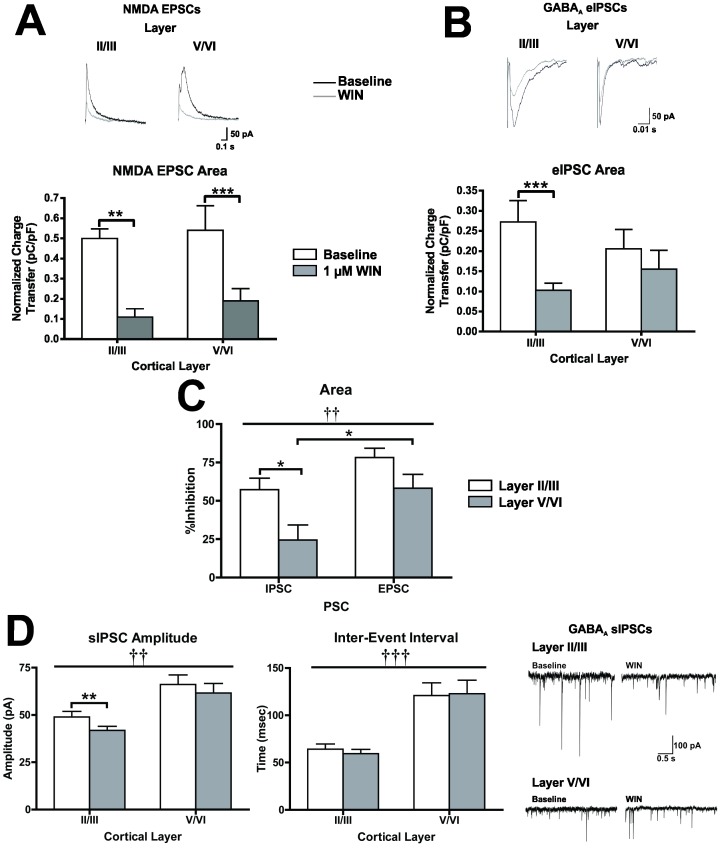
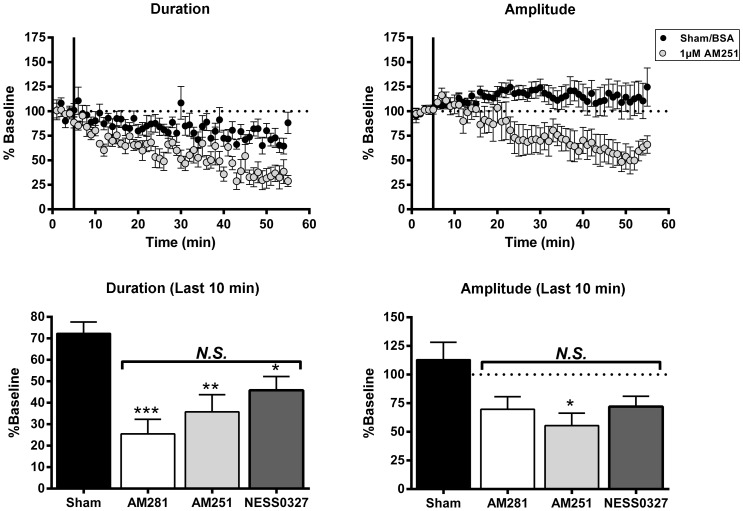
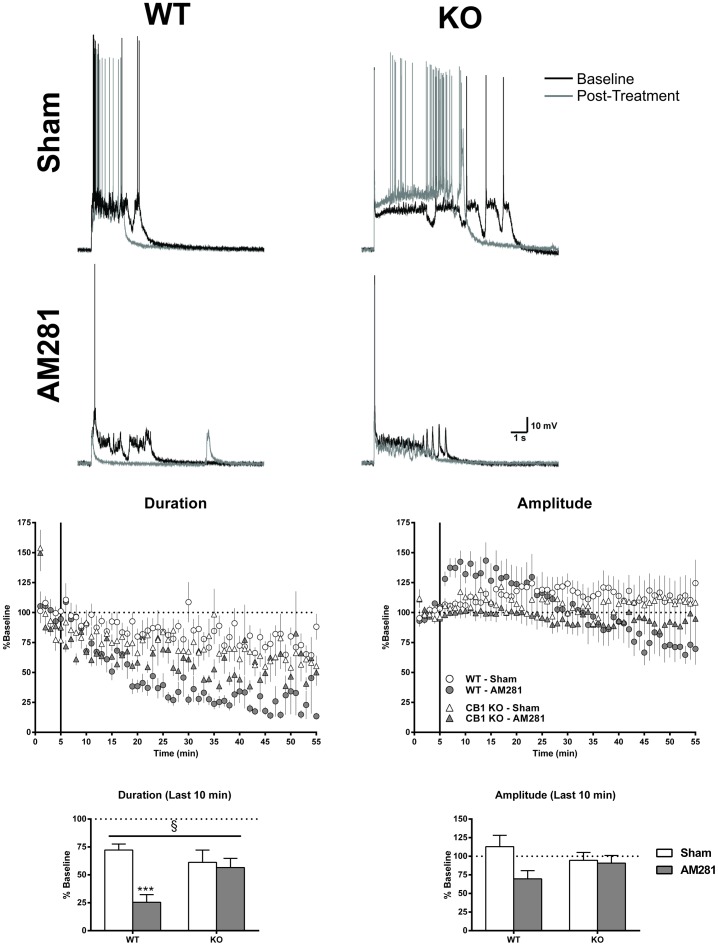
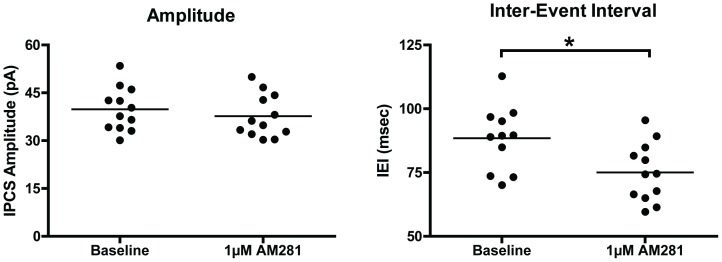
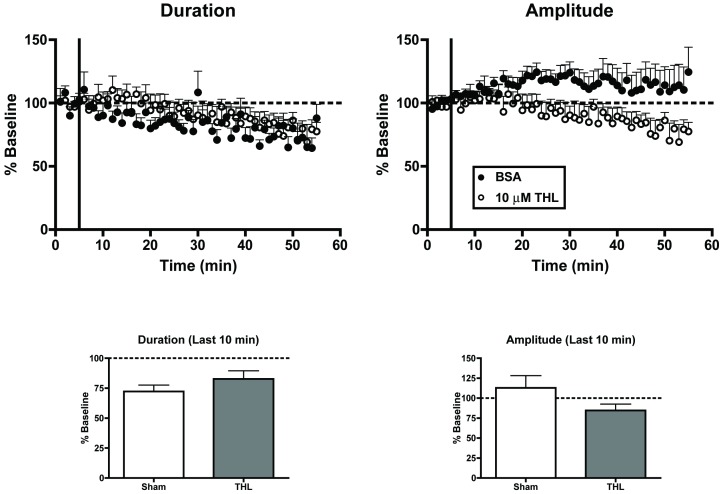
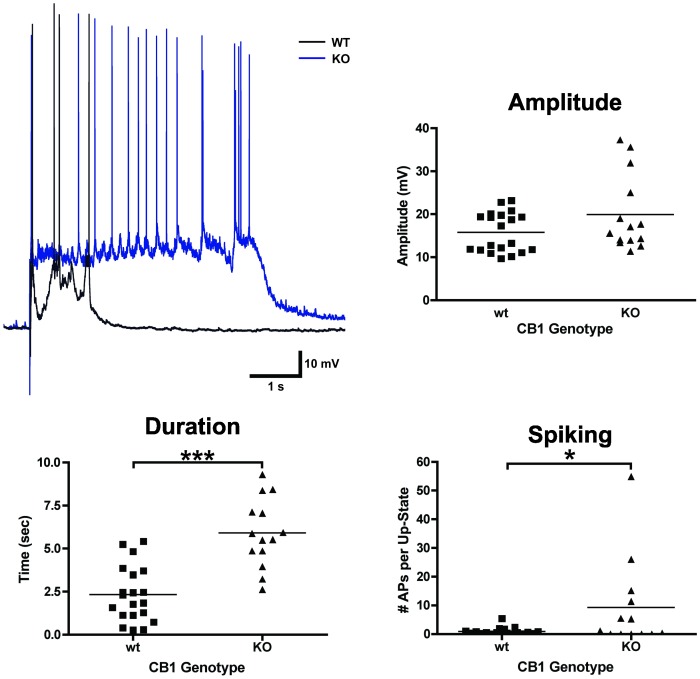
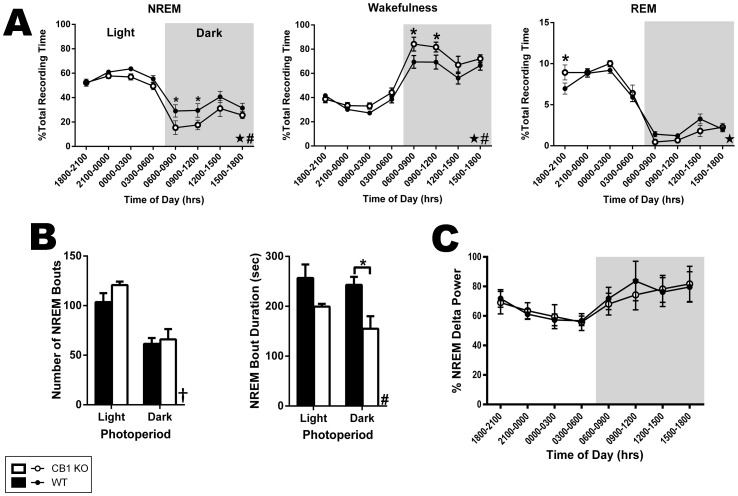
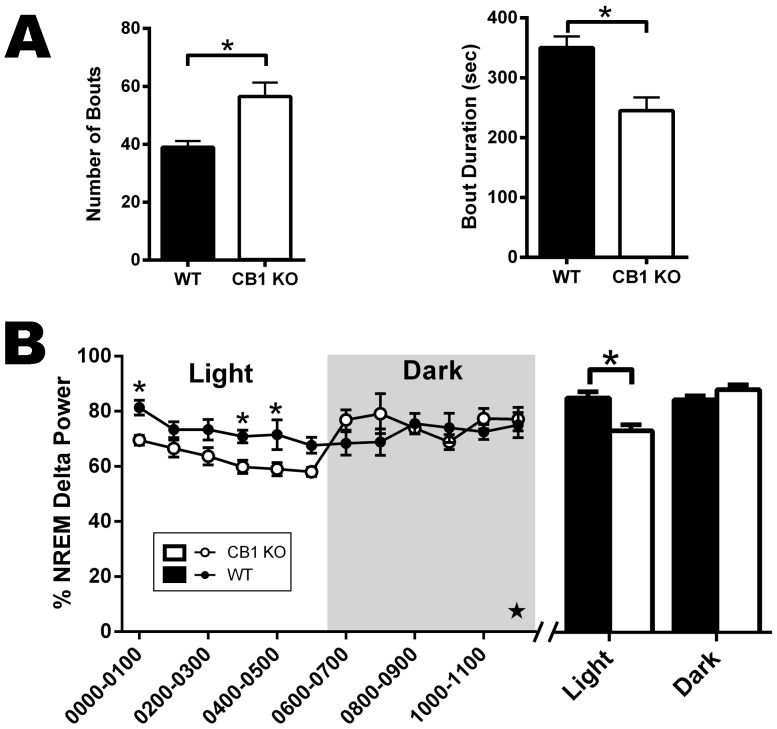
Up-/down-state transitions are a form of network activity observed when sensory input into the cortex is diminished such as during non-REM sleep. Up-states emerge from coordinated signaling between glutamatergic and GABAergic synapses and are modulated by systems that affect the balance between inhibition and excitation. We hypothesized that the endocannabinoid (EC) system, a neuromodulatory system intrinsic to the cortical microcircuitry, is an important regulator of up-states and sleep. To test this hypothesis, up-states were recorded from layer V/VI pyramidal neurons in organotypic cultures of wild-type or CB1R knockout (KO) mouse prefrontal cortex. Activation of the cannabinoid 1 receptor (CB1) with exogenous agonists or by blocking metabolism of endocannabinoids, anandamide or 2-arachidonoyl glycerol, increased up-state amplitude and facilitated action potential discharge during up-states. The CB1 agonist also produced a layer II/III-selective reduction in synaptic GABAergic signaling that may underlie its effects on up-state amplitude and spiking. Application of CB1 antagonists revealed that an endogenous EC tone regulates up-state duration. Paradoxically, the duration of up-states in CB1 KO cultures was increased suggesting that chronic absence of EC signaling alters cortical activity. Consistent with increased cortical excitability, CB1 KO mice exhibited increased wakefulness as a result of reduced NREM sleep and NREM bout duration. Under baseline conditions, NREM delta (0.5-4 Hz) power was not different in CB1 KO mice, but during recovery from forced sleep deprivation, KO mice had reduced NREM delta power and increased sleep fragmentation. Overall, these findings demonstrate that the EC system actively regulates cortical up-states and important features of NREM sleep such as its duration and low frequency cortical oscillations.


Conflict of interest statement

Competing Interests: The authors have declared that no competing interests exist.

Figures

Figure 1
Figure 1. The CB1 agonist WIN 55,212-2 enhances up-state amplitude and spiking.
A, example traces from the same neuron before and after application of WIN (1 µM) and summary data from these experiments. In graphs, connected points represent data from the same neuron. B, comparison of the change in up-state parameters following WIN treatment in wt and CB1 KO cultures. Bars represent mean ± SEM of difference scores for each measure of up-states (N = 7 cells). Symbols: *p<0.05, **p<0.01, and ***p<0.001.
Figure 2
Figure 2. Selectively increasing either AEA or 2-AG by inhibiting FAAH or MAGL, respectively, increases up-state amplitude and spiking.
A, effect of FAAH inhibition with URB597 (1 µM) on up-state parameters. B, effect of MAGL inhibition with JZL184 (1 µM) on up-state parameters. Connected points represent data from the same the cell during baseline and in the presence of the drug. Symbols: *p<0.05 and **p<0.01.
Figure 3
Figure 3. Modulation of TRPV1 receptor function does not alter up-states.
Top graphs: time course of measures of up-state duration and amplitude in cultures treated with sham conditions, the TRPV1 agonist capsaicin (CAP; 3 µM), or the TRPV1 antagonist capsazepine (CPZ; 10 µM). Bottom graphs: summary data from the three treatment conditions binned over the last 10 min and normalized to their respective baselines. Bars represent mean ± SEM.
Figure 4
Figure 4. Laminar and synapse specific effects of CB1 activation with 1 µM WIN in organotypic cultures of PFC.
A, Effect of WIN on evoked NMDA EPSCs recorded from layer II/III and layer V/VI PNs (N = 9). B, Effect of WIN on evoked (top graphs) and spontaneous (bottom graphs) GABAA IPSCs recorded from layer II/III and layer V/VI pyramidal neurons (N = 8–11). In panels A and B, white bars represent baseline and grey bars represent PSCs in the presence of WIN. Traces to the right of panels A and B represent example traces from these experiments. For evoked PSCs, black traces represent baseline and grey traces represent PSCs in the presence of WIN. Significant main effects of cortical layer are denoted by a dagger (†) and significant pair-wise comparisons between baseline and WIN are indicated by an asterisks (*). C, comparison of the inhibitory effects of WIN between PSC type and across cortical layers (N = 8–12). White bars represent data from layer II/III PNs and grey bars represent recordings from layer V/VI PNs. Significant main effects of PSC type are denoted by a dagger (†) and significant post-hoc comparisons are indicated by an asterisks (*). For all graphs bars represent mean ± SEM. For all symbols conferring statistical significance: single symbol p<0.05, double symbol p<0.01, triple symbol p<0.001.
Figure 5
Figure 5. CB1 antagonists reduce up-state amplitude and duration.
Top graphs: time course of measures of up-state duration and amplitude in cultures treated with sham conditions or the CB1 inverse agonist AM251 (1 µM). Points represent group means ± SEM. Bottom graphs: summary data from the four treatment conditions (sham, 1 µM AM281, 1 µM AM 251, 0.1 µM NESS0327) binned over the last 10 min and normalized to their respective baselines (N = 6–10). Bars represent group means ± SEM. Asterisks indicate significant difference from the sham group, and N.S. indicates no significant differences between drug treated groups. Symbols: *p<0.05, **p<0.01, ***p<0.001.
Figure 6
Figure 6. AM281 reduces up-state duration via a CB1-dependent mechanism.
Top panel: example traces from each of the four groups showing baseline up-states (black traces) and those following 50 min of drug application (grey traces). Middle panel: time course of measures of up-state duration and amplitude in wt and CB1 KO cultures under sham conditions or treated with the CB1 inverse agonist AM281 (1 µM). Points are normalized to the pre-drug values for each genotype and represent group means ± SEM (N = 6–11) and. Bottom panel: summary data from the four groups binned over the last 10 min and normalized to their respective baselines (N = 8–10). Bars represent group means ± SEM. Symbols: § - significant interaction (p<0.05), *** - significant post-hoc comparison with wt sham (p<0.001).
Figure 7
Figure 7. AM281 reduces the inter-event interval of GABAA sIPSCs in layer II/III PNs.
Each data point represents the average sIPSC amplitude or inter-event interval from one neuron (N = 11–13). Baseline data points represent different cells (but the same cultures) from those recorded after 1 hr of incubation with AM281 (1 µM). Horizontal lines represent group means. Asterisks (*) represents a significant group difference, p<0.05.
Figure 8
Figure 8. Blockade of 2-AG synthesis does not alter up-state parameters.
Top graphs: time course of measures of up-state duration and amplitude in sham treated cultures and those treated with the DAGL inhibitor tetrahydrolipstatin (THL; 10 µM). Bottom graphs: summary data from the two treatment conditions binned over the last 10 min and normalized to their respective baselines. Bars represent mean ± SEM.
Figure 9
Figure 9. Up-states in CB1 KO cultures are longer than those recorded in wt cultures.
Example traces in upper left-hand corner: black trace is a representative example of an up-state from a wt culture and blue trace is an example from a CB1 KO culture. Graphs show summary data from this series of experiments. Each data point represents the average measurement from a given neuron. Horizontal lines represent group means. Asterisks represent significant group differences. Symbols: *p<0.05 and ***p<0.001.
Figure 10
Figure 10. Genetic deletion of the CB1 receptor reduces the stability of NREM bouts by decreasing the time spent in NREM and increasing WK.
A, Comparison between CB1 KO and wt mice (N = 6 in each group) in the time spent in NREM sleep, awake, and in REM sleep across the circadian period during baseline recordings. Data in each epoch were normalized to the total recording time to yield the percent of time spent in each state. B, Comparison of NREM architecture between genotypes. Graphs show data pertaining to the number and duration of NREM bouts. C, Comparison between genotypes for measures of delta power during NREM across the circadian cycle. Data represent the results of power spectral analysis of ECoG waveforms recorded during NREM sleep normalized to the total power across the power spectrum (0.5–20 Hz) for each time bin. For all graphs, black bars/circles represent data from wt mice, and white bars/circles represent data from CB1 KO mice. In time series graphs, the white background indicated the light photoperiod and the grey background denotes the dark photoperiod. Data represent the means ± SEM of each genotype within the specified time bin or photoperiod. For A and C, data were grouped in 3 hr bins. In B, each bar represents a 12 hr (one photoperiod) bin. Significant 3-way interactions between photoperiod, time of day, and genotype are denoted with stars (★). Significant main effects of genotype are denoted with pound signs (#). Significant main effects of photoperiod are denoted with a dagger (†). Significant pair-wise comparisons are denoted with asterisks (*).
Figure 11
Figure 11. During recovery from total sleep deprivation (TSD), CB1 KO mice exhibit altered sleep architecture and reduced NREM delta power compared to wt mice.
A, Number and duration of NREM bouts in the last 6± SEM from each genotype (N = 6 for each group). B, NREM delta power during the 12 hr immediately following TSD. Grey background of line graph represents dark photoperiod and white background denotes the light photoperiod. Data in the line graph represent 1 hr bins, and data in the bar graph represent mean ± SEM for 6 hr bins of the specified photoperiod. For all graphs, white bars/circles represent data from CB1 KO mice and black bars/circles represent data from wt mice. Significant 3-way interactions between photoperiod, time of day, and genotype are denoted with stars (★). Significant pair-wise comparisons are denoted with asterisks (*).

Similar articles

Cited by

References

    1. Amzica F, Steriade M (1998) Electrophysiological correlates of sleep delta waves. Electroencephalography and Clinical Neurophysiology 107: 69–83. - PubMed
    1. Steriade M, Nuñez A, Amzica F (1993) A novel slow (<1 Hz) oscillation of neocortical neurons in vivo: depolarizing and hyperpolarizing components. J Neurosci 13: 3252–3265. - PMC - PubMed
    1. Seamans JK, Nogueira L, Lavin A (2003) Synaptic basis of persistent activity in prefrontal cortex in vivo and in organotypic cultures. Cereb Cortex 13: 1242–1250. - PMC - PubMed
    1. Kroener S, Chandler LJ, Phillips PE, Seamans JK (2009) Dopamine modulates persistent synaptic activity and enhances the signal-to-noise ratio in the prefrontal cortex. PLoS ONE 4: e6507. - PMC - PubMed
    1. Lambe EK, Aghajanian GK (2006) Hallucinogen-induced UP states in the brain slice of rat prefrontal cortex: role of glutamate spillover and NR2B-NMDA receptors. Neuropsychopharmacology 31: 1682–1689. - PubMed

Publication types

MeSH terms

LinkOut - more resources