Interventional optical molecular imaging guidance during percutaneous biopsy
- PMID: 24520946
- PMCID: PMC4263633
- DOI: 10.1148/radiol.14131880
Interventional optical molecular imaging guidance during percutaneous biopsy
Abstract
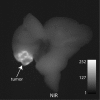
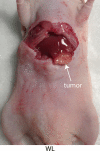
Purpose: To investigate indocyanine green (ICG) as a molecular beacon for malignant lesions within the liver and evaluate the ability of a developed handheld imaging system to allow measurement of ICG fluorescence within focal hepatic lesions with high target-to-background ratios in a mouse model.
Materials and methods: All animal experiments were approved by the institutional animal care committee. A handheld optical molecular imaging device was constructed to pass through the introducer needle of a standard percutaneous biopsy kit. An ex vivo phantom system was constructed to quantify tissue attenuation properties of ICG in liver parenchyma. Subsequently, intrahepatic colorectal cancer metastases were generated in nude mice, and epifluorescence imaging of ICG, as well as histologic analysis of the explanted livers, was performed at 3 weeks after implantation (n = 6). Epifluorescence imaging with the handheld imaging device was then performed on intrahepatic colorectal metastases after the administration of ICG (n = 15) at 3, 6, and 24 hours after injection. Target-to-background ratios were calculated for each time point. Subsequently, a core biopsy of intrahepatic colorectal metastases was performed by using a standard clinical 18-gauge biopsy needle.
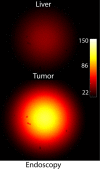
Results: There was avid localization of ICG to the focal lesions at all time points. Similarly, fluorescence within the tumors was greater than that within normal liver, as detected with the handheld imaging system (mean target-to-background ratio ± standard deviation, 3.9 ± 0.2 at 24 hours). A core biopsy of tumor and normal adjacent liver by using a standard biopsy needle demonstrated a sharp margin of fluorescence intensity at the tumor-liver interface.
Conclusion: The custom-designed molecular imaging device, in combination with ICG, readily allowed differentiation between normal and malignant tissue in a murine model of intrahepatic colorectal metastasis.
Figures


Comment in
-
Science to practice: percutaneous biopsies in the NIR future--will fluorescence guide the way?Radiology. 2014 Jun;271(3):623-4. doi: 10.1148/radiol.14140344. Radiology. 2014. PMID: 24848955 Free PMC article.
Similar articles
-
Prospective trial with optical molecular imaging for percutaneous interventions in focal hepatic lesions.Radiology. 2015 Mar;274(3):917-26. doi: 10.1148/radiol.14141308. Epub 2014 Oct 10. Radiology. 2015. PMID: 25302707 Free PMC article. Clinical Trial.
-
Electromagnetic Tracking and Optical Molecular Imaging Guidance for Liver Biopsy and Point-of-Care Tissue Assessment in Phantom and Woodchuck Hepatocellular Carcinoma.Cardiovasc Intervent Radiol. 2021 Sep;44(9):1439-1447. doi: 10.1007/s00270-021-02853-x. Epub 2021 May 21. Cardiovasc Intervent Radiol. 2021. PMID: 34021380 Free PMC article.
-
Near-infrared fluorescence imaging of liver metastases in rats using indocyanine green.J Surg Res. 2012 May 15;174(2):266-71. doi: 10.1016/j.jss.2011.01.009. Epub 2011 Feb 2. J Surg Res. 2012. PMID: 21396660 Free PMC article.
-
[A new approach for studying the retinal and choroidal circulation].Nippon Ganka Gakkai Zasshi. 2004 Dec;108(12):836-61; discussion 862. Nippon Ganka Gakkai Zasshi. 2004. PMID: 15656089 Review. Japanese.
-
Fluorescence-guided surgery for liver tumors.J Surg Oncol. 2018 Aug;118(2):324-331. doi: 10.1002/jso.25128. Epub 2018 Aug 11. J Surg Oncol. 2018. PMID: 30098296 Review.
Cited by
-
Imaging of Liver Tumors Using Surface-Enhanced Raman Scattering Nanoparticles.ACS Nano. 2016 May 24;10(5):5015-26. doi: 10.1021/acsnano.5b07200. Epub 2016 May 10. ACS Nano. 2016. PMID: 27078225 Free PMC article.
-
Pharmacodynamic endpoints as clinical trial objectives to answer important questions in oncology drug development.Semin Oncol. 2016 Aug;43(4):514-25. doi: 10.1053/j.seminoncol.2016.07.002. Epub 2016 Jul 26. Semin Oncol. 2016. PMID: 27663483 Free PMC article. Review.
-
Optical imaging guidance in oncologic surgery and interventional oncology.Pharmacol Res. 2025 Feb;212:107612. doi: 10.1016/j.phrs.2025.107612. Epub 2025 Jan 17. Pharmacol Res. 2025. PMID: 39826822 Free PMC article. Review.
-
Pilot Clinical Trial of Indocyanine Green Fluorescence-Augmented Colonoscopy in High Risk Patients.Gastroenterol Res Pract. 2016;2016:6184842. doi: 10.1155/2016/6184842. Epub 2016 Feb 17. Gastroenterol Res Pract. 2016. PMID: 26989406 Free PMC article.
-
Bendable long graded index lens microendoscopy.Opt Express. 2022 Sep 26;30(20):36651-36664. doi: 10.1364/OE.468827. Opt Express. 2022. PMID: 36258589 Free PMC article.
References
-
- de Lope CR, Tremosini S, Forner A, Reig M, Bruix J. Management of HCC. J Hepatol 2012;56(Suppl 1):S75–S87. - PubMed
-
- Ishizawa T, Fukushima N, Shibahara J, et al. . Real-time identification of liver cancers by using indocyanine green fluorescent imaging. Cancer 2009;115(11):2491–2504. - PubMed
-
- Morita Y, Sakaguchi T, Unno N, et al. . Detection of hepatocellular carcinomas with near-infrared fluorescence imaging using indocyanine green: its usefulness and limitation. Int J Clin Oncol 2013;18(2):232–241. - PubMed
MeSH terms
Substances
Grants and funding
LinkOut - more resources
Full Text Sources
Other Literature Sources
Medical

