

Platelet mitochondrial membrane depolarization reflects disease severity in patients with sepsis and correlates with clinical outcome
- PMID: 24521521
- PMCID: PMC4056796
- DOI: 10.1186/cc13724
Platelet mitochondrial membrane depolarization reflects disease severity in patients with sepsis and correlates with clinical outcome
Abstract
Introduction: Sepsis is still a leading cause of morbidity and mortality, even in modern times, and thrombocytopenia has been closely associated with unfavorable disease outcome. Decreases in mitochondrial membrane potential (depolarization) were found in different tissues during sepsis. Previous work suggests that mitochondrial dysfunction of platelets correlates with clinical disease activity in sepsis. However, platelet mitochondrial membrane potential (Mmp) has not been investigated in a clinical follow-up design and not with regard to disease outcome.
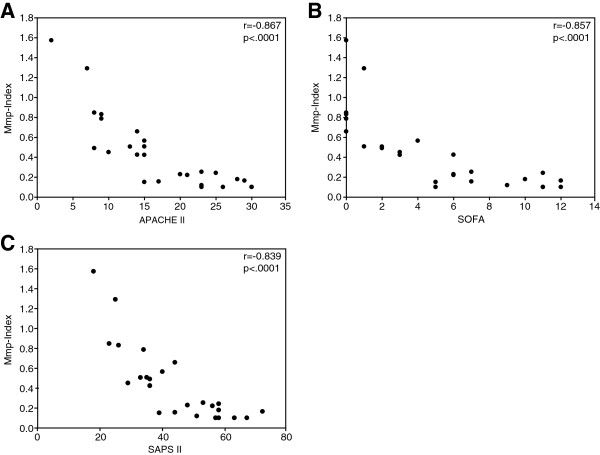
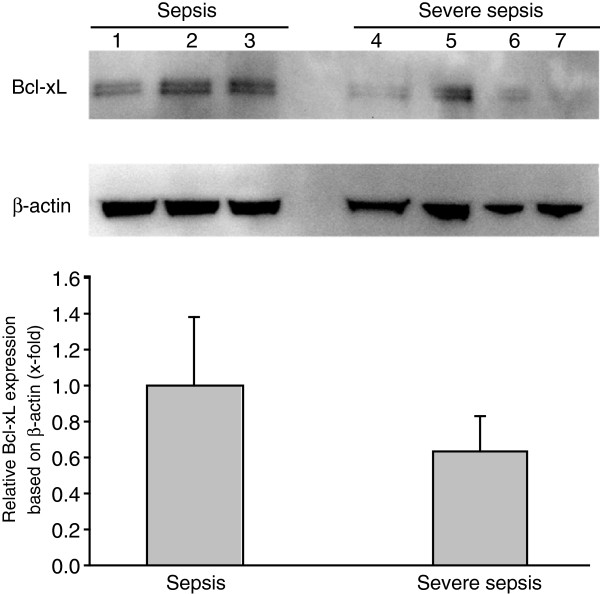
Methods: In this study, platelet mitochondrial membrane depolarization was assessed by means of a fluorescent Mmp-Index with flow cytometry in 26 patients with sepsis compared with control patients. Platelet Mmp-Index on admission was correlated with the clinical disease scores Acute Physiology and Chronic Health Evaluation Score II (APACHE II), Sequential Organ Failure Score (SOFA), and Simplified Acute Physiology Score II (SAPS II). Finally, platelet Mmp-Index on admission and follow-up were compared in the group of sepsis survivors and nonsurvivors. Expression of the prosurvival protein Bcl-xL in platelets was quantified by immunoblotting.
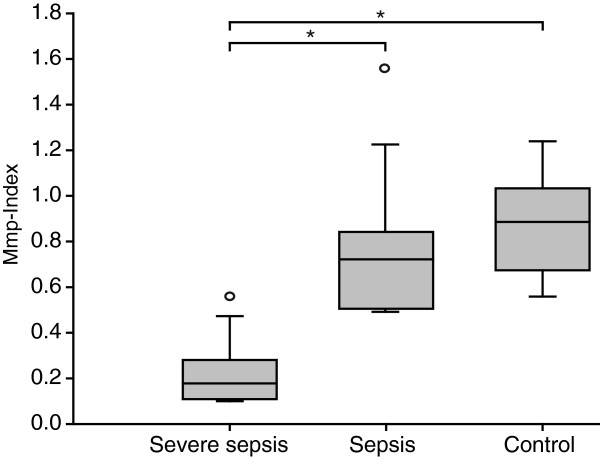
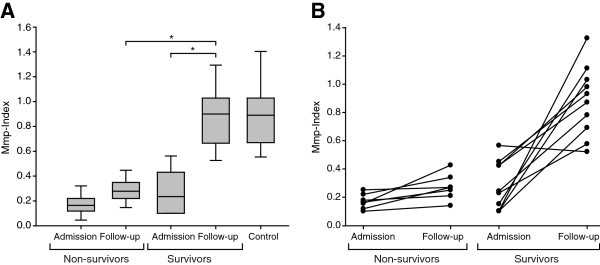
Results: Platelet mitochondrial membrane depolarization correlated significantly with the simultaneously assessed clinical disease severity by APACHE II (r = -0.867; P < 0.0001), SOFA (r = -0.857; P <0.0001), and SAPS II score (r = -0.839; P < 0.0001). Patients with severe sepsis showed a significant reduction in platelet Mmp-Index compared with sepsis without organ failure (0.18 (0.12 to 0.25) versus 0.79 (0.49 to 0.85), P < 0.0006) or with the control group (0.18 (0.12 to 0.25) versus 0.89 (0.68 to 1.00), P < 0.0001). Platelet Mmp-Index remained persistently low in sepsis nonsurvivors (0.269 (0.230 to 0.305)), whereas we observed recovery of platelet Mmp-Index in the survivor group (0.9 (0.713 to 1.017)). Furthermore, the level of prosurvival protein Bcl-xL decreased in platelets during severe sepsis.
Conclusion: In this study, we demonstrated that mitochondrial membrane depolarization in platelets correlates with clinical disease severity in patients with sepsis during the disease course and may be a valuable adjunct parameter to aid in the assessment of disease severity, risk stratification, and clinical outcome.
Figures
Comment in
-
Platelet membrane potential: unable to pull the plug on sepsis.Crit Care. 2014 May 12;18(3):428. doi: 10.1186/cc13869. Crit Care. 2014. PMID: 25032890 Free PMC article. No abstract available.
References
-
- Vincent JL, de Mendonca A, Cantraine F, Moreno R, Takala J, Suter PM, Sprung CL, Colardyn F, Blecher S. Use of the SOFA score to assess the incidence of organ dysfunction/failure in intensive care units: results of a multicenter, prospective study: Working Group on “sepsis-related problems” of the European Society of Intensive Care Medicine. Crit Care Med. 1998;26:1793–1800. doi: 10.1097/00003246-199811000-00016. - DOI - PubMed
-
- Engelmann B, Massberg S. Thrombosis as an intravascular effector of innate immunity. Nat Rev Immunol. 2013;13:34–45. - PubMed
Publication types
MeSH terms
LinkOut - more resources
Full Text Sources
Other Literature Sources
Medical
Research Materials
