. 2014 Aug;134(2):350-9.
doi: 10.1016/j.jaci.2013.12.1071. Epub 2014 Feb 9.

Prevalence of allergic sensitization in the United States: results from the National Health and Nutrition Examination Survey (NHANES) 2005-2006

Affiliations

Prevalence of allergic sensitization in the United States: results from the National Health and Nutrition Examination Survey (NHANES) 2005-2006

Päivi M Salo et al. J Allergy Clin Immunol. 2014 Aug.

Abstract

Background: Allergic sensitization is an important risk factor for the development of atopic disease. The National Health and Nutrition Examination Survey (NHANES) 2005-2006 provides the most comprehensive information on IgE-mediated sensitization in the general US population.

Objective: We investigated clustering, sociodemographic, and regional patterns of allergic sensitization and examined risk factors associated with IgE-mediated sensitization.

Methods: Data for this cross-sectional analysis were obtained from NHANES 2005-2006. Participants aged 1 year or older (n = 9440) were tested for serum specific IgEs (sIgEs) to inhalant and food allergens; participants 6 years or older were tested for 19 sIgEs, and children aged 1 to 5 years were tested for 9 sIgEs. Serum samples were analyzed by using the ImmunoCAP System. Information on demographics and participants' characteristics was collected by means of questionnaire.

Results: Of the study population aged 6 years and older, 44.6% had detectable sIgEs, whereas 36.2% of children aged 1 to 5 years were sensitized to 1 or more allergens. Allergen-specific IgEs clustered into 7 groups that might have largely reflected biological cross-reactivity. Although sensitization to individual allergens and allergen types showed regional variation, the overall prevalence of sensitization did not differ across census regions, except in early childhood. In multivariate modeling young age, male sex, non-Hispanic black race/ethnicity, geographic location (census region), and reported pet avoidance measures were most consistently associated with IgE-mediated sensitization.

Conclusions: The overall prevalence of allergic sensitization does not vary across US census regions, except in early life, although allergen-specific sensitization differs based on sociodemographic and regional factors. Biological cross-reactivity might be an important but not the sole contributor to the clustering of allergen-specific IgEs.

Keywords: Allergen; allergic sensitization; allergy; serum IgE.


Figures

Figure 1
Figure 1
Prevalence of positive serum IgE tests and distributions of the allergen-specific antibody concentrations in the US population (A, B: Subjects aged 6 years and older; C,D: Subjects aged 1–5 years). Box plots display the minimum and maximum values and the 25th, 50th, and 75th percentiles. The measuring range was 0.35–1000 kUa/L.
Figure 2
Figure 2
Clustering of the allergen-specific IgEs. The dendrogram (right) employs hierarchical clustering to group similar sIgEs based on the log-transformed correlation matrix (left). Hierarchical cluster analysis identified 7 IgE clusters: 1) plants (grass-, tree-, weed-, and peanut-specific IgEs); 2) dust mites (D. farinae and D. pteronyssinus); 3) pets (dog and cat); 4) cockroach and shrimp; 5) molds (Alternaria and Aspergillus); 6) foods (egg white, cow’s milk); and 7) rodents (mouse and rat).
Figure 2
Figure 2
Clustering of the allergen-specific IgEs. The dendrogram (right) employs hierarchical clustering to group similar sIgEs based on the log-transformed correlation matrix (left). Hierarchical cluster analysis identified 7 IgE clusters: 1) plants (grass-, tree-, weed-, and peanut-specific IgEs); 2) dust mites (D. farinae and D. pteronyssinus); 3) pets (dog and cat); 4) cockroach and shrimp; 5) molds (Alternaria and Aspergillus); 6) foods (egg white, cow’s milk); and 7) rodents (mouse and rat).
Figure 3
Figure 3
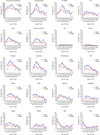
Prevalence of positive serum IgE tests by age among the US population. Solid symbols represent statistically significant differences, whereas prevalences that are not statistically different are marked with open symbols. Red symbols indicate the subgroup of allergens that were measured in 1–5 year old children.
Figure 4
Figure 4
Prevalence of positive serum IgE tests by demographic characteristics in the US population (A: Subjects aged 6 years and older; B: Subjects aged 1–5 years). Solid symbols represent statistically significant differences, whereas prevalences that are not statistically different are marked with open symbols.
Figure 5
Figure 5
Prevalence of positive serum IgE tests by census region in the US population (A: Subjects aged 6 years and older; B: Subjects aged 1–5 years).

Comment in

Similar articles

Cited by

References

    1. World Allergy Organization (WAO) Milwaukee, WI: World Allergy Organization; 2011. [Cited 2012 Mar 11]. White Book on Allergy. Available from http://www.worldallergy.org/UserFiles/file/WAO-White-Book-on-Allergy_web....
    1. Meltzer EO, Blaiss MS, Derebery MJ, Mahr TA, Gordon BR, Sheth KK, et al. Burden of allergic rhinitis: results from the Pediatric Allergies in America survey. The Journal of allergy and clinical immunology. 2009;124:S43–S70. - PubMed
    1. Ebert CS, Jr, Pillsbury HC., 3rd Epidemiology of allergy. Otolaryngologic clinics of North America. 2011;44:537–548. vii. - PubMed
    1. Hamilton RG. Clinical laboratory assessment of immediate-type hypersensitivity. The Journal of allergy and clinical immunology. 2010;125:S284–S296. - PubMed
    1. Salo PM, Calatroni A, Gergen PJ, Hoppin JA, Sever ML, Jaramillo R, et al. Allergy-related outcomes in relation to serum IgE: results from the National Health and Nutrition Examination Survey 2005–2006. The Journal of allergy and clinical immunology. 2011;127:1226–1235. e7. - PMC - PubMed

Publication types

MeSH terms