

Multisystem component phenotypes of bipolar disorder for genetic investigations of extended pedigrees
- PMID: 24522887
- PMCID: PMC4045237
- DOI: 10.1001/jamapsychiatry.2013.4100
Multisystem component phenotypes of bipolar disorder for genetic investigations of extended pedigrees
Erratum in
-
Errors in Identification of 17 of 527 Brain Images in Genetic Study of Phenotypes Associated With Bipolar Disorder.JAMA Psychiatry. 2016 Jul 1;73(7):758-9. doi: 10.1001/jamapsychiatry.2016.1051. JAMA Psychiatry. 2016. PMID: 27191702 No abstract available.
-
Errors in Data.JAMA Psychiatry. 2016 Jul 1;73(7):759. doi: 10.1001/jamapsychiatry.2016.1117. JAMA Psychiatry. 2016. PMID: 27192493 No abstract available.
Abstract
Importance: Genetic factors contribute to risk for bipolar disorder (BP), but its pathogenesis remains poorly understood. A focus on measuring multisystem quantitative traits that may be components of BP psychopathology may enable genetic dissection of this complex disorder, and investigation of extended pedigrees from genetically isolated populations may facilitate the detection of specific genetic variants that affect BP as well as its component phenotypes.
Objective: To identify quantitative neurocognitive, temperament-related, and neuroanatomical phenotypes that appear heritable and associated with severe BP (bipolar I disorder [BP-I]) and therefore suitable for genetic linkage and association studies aimed at identifying variants contributing to BP-I risk.
Design, setting, and participants: Multigenerational pedigree study in 2 closely related, genetically isolated populations: the Central Valley of Costa Rica and Antioquia, Colombia. A total of 738 individuals, all from Central Valley of Costa Rica and Antioquia pedigrees, participated; among them, 181 have BP-I.
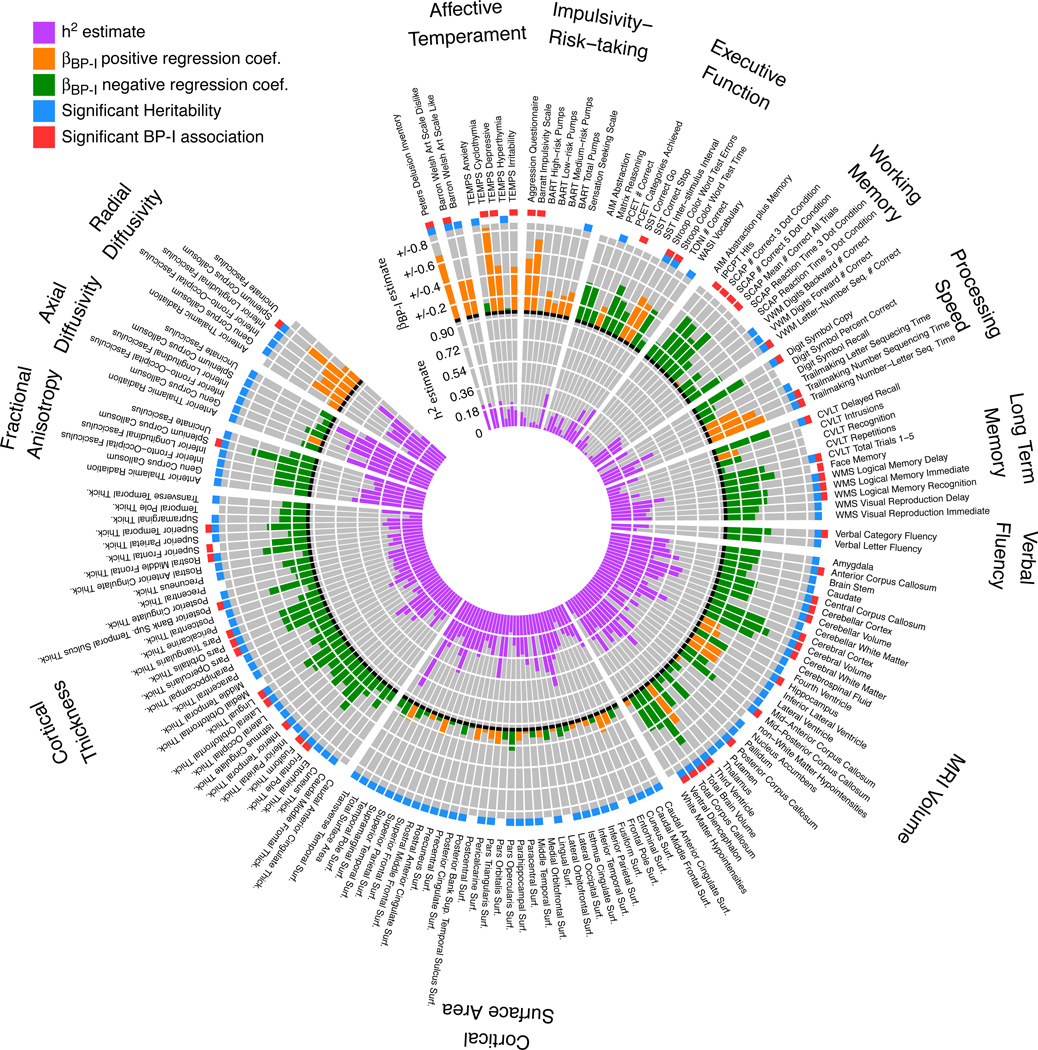
Main outcomes and measures: Familial aggregation (heritability) and association with BP-I of 169 quantitative neurocognitive, temperament, magnetic resonance imaging, and diffusion tensor imaging phenotypes.
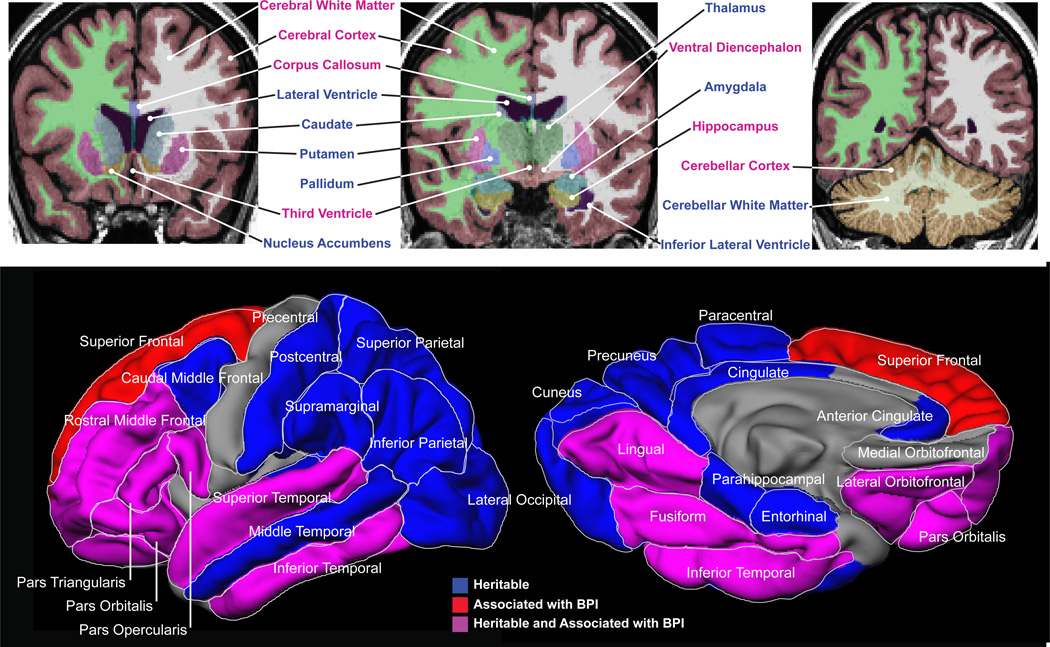
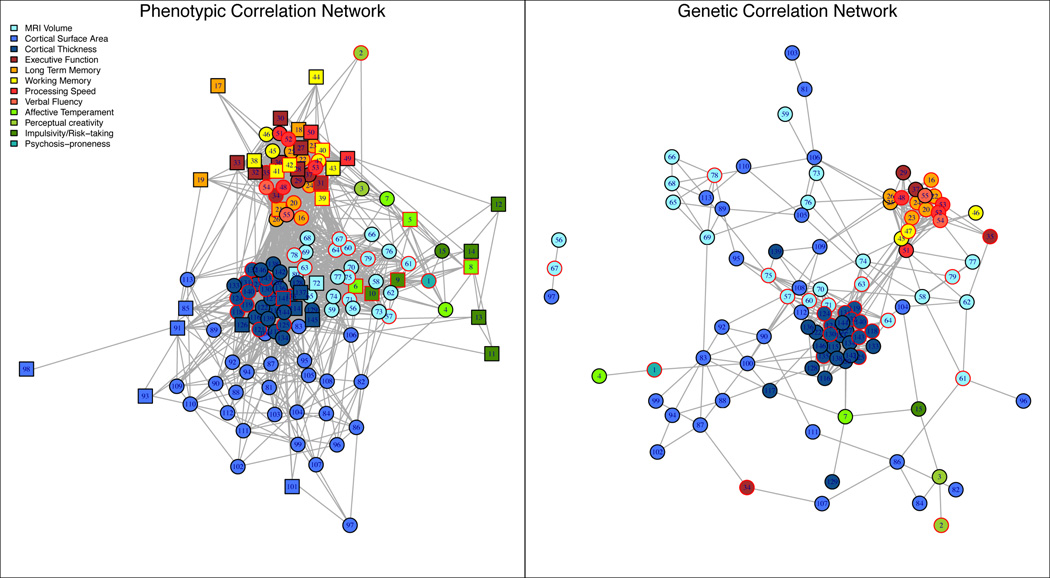
Results: Of 169 phenotypes investigated, 126 (75%) were significantly heritable and 53 (31%) were associated with BP-I. About one-quarter of the phenotypes, including measures from each phenotype domain, were both heritable and associated with BP-I. Neuroimaging phenotypes, particularly cortical thickness in prefrontal and temporal regions as well as volume and microstructural integrity of the corpus callosum, represented the most promising candidate traits for genetic mapping related to BP based on strong heritability and association with disease. Analyses of phenotypic and genetic covariation identified substantial correlations among the traits, at least some of which share a common underlying genetic architecture.
Conclusions and relevance: To our knowledge, this is the most extensive investigation of BP-relevant component phenotypes to date. Our results identify brain and behavioral quantitative traits that appear to be genetically influenced and show a pattern of BP-I association within families that is consistent with expectations from case-control studies. Together, these phenotypes provide a basis for identifying loci contributing to BP-I risk and for genetic dissection of the disorder.
Conflict of interest statement
None of the other authors have financial conflicts of interest to report.
Figures
References
-
- Goodwin FK, Jamison KR. Manic-Depressive Illness: Bipolar Disorders and Recurrent Depression: Bipolar Disorders and Recurrent Depression. USA: Oxford University Press; 2007.
-
- McGuffin P, Rijsdijk F, Andrew M, Sham P, Katz R, Cardno A. The heritability of bipolar affective disorder and the genetic relationship to unipolar depression. Arch Gen Psychiatry. 2003;60:497–502. - PubMed
-
- Fears SC, Mathews CM, Freimer NF. Kaplan & Sadock's Comprehensive Textbook of Psychiatry. Philadelphia, PA, USA: Lippincott Williams & Wilkins; 2009. Genetic Linkage Analysis of Psychiatric Disorders; pp. 320–332.
Publication types
MeSH terms
Grants and funding
- K23 MH074644/MH/NIMH NIH HHS/United States
- R01 MH095454/MH/NIMH NIH HHS/United States
- P30 NS062691/NS/NINDS NIH HHS/United States
- R01MH075007/MH/NIMH NIH HHS/United States
- P30NS062691/NS/NINDS NIH HHS/United States
- R01MH095454/MH/NIMH NIH HHS/United States
- K23MH074644-01/MH/NIMH NIH HHS/United States
- R01 MH075007/MH/NIMH NIH HHS/United States
- R01HG006695/HG/NHGRI NIH HHS/United States
- T32 NS048004/NS/NINDS NIH HHS/United States
- K08MH086786/MH/NIMH NIH HHS/United States
- K08 MH086786/MH/NIMH NIH HHS/United States
- R01 MH113078/MH/NIMH NIH HHS/United States
- R01 HG006695/HG/NHGRI NIH HHS/United States
