. 2014 Jan 29:8:11.
doi: 10.3389/fncel.2014.00011. eCollection 2014.

Selective increases of AMPA, NMDA, and kainate receptor subunit mRNAs in the hippocampus and orbitofrontal cortex but not in prefrontal cortex of human alcoholics

Affiliations

Selective increases of AMPA, NMDA, and kainate receptor subunit mRNAs in the hippocampus and orbitofrontal cortex but not in prefrontal cortex of human alcoholics

Zhe Jin et al. Front Cell Neurosci. .

Abstract

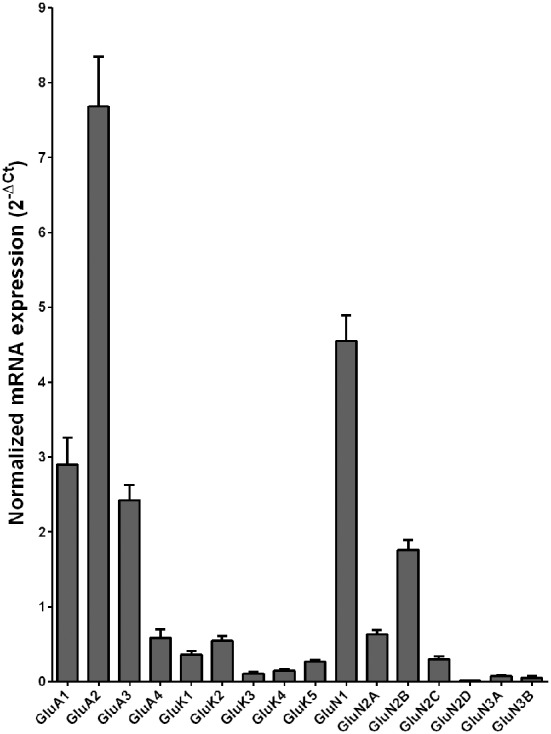
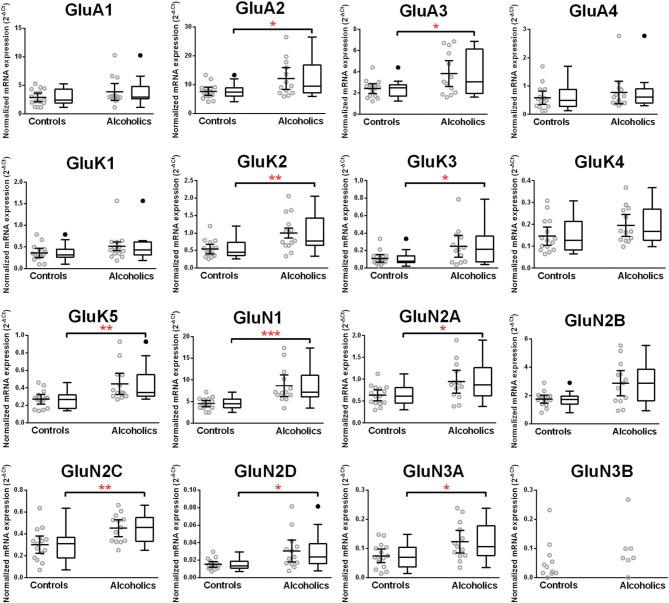
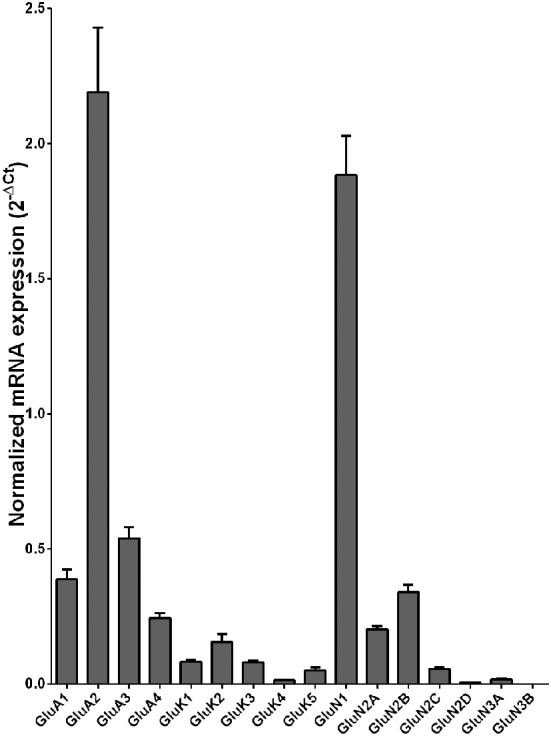
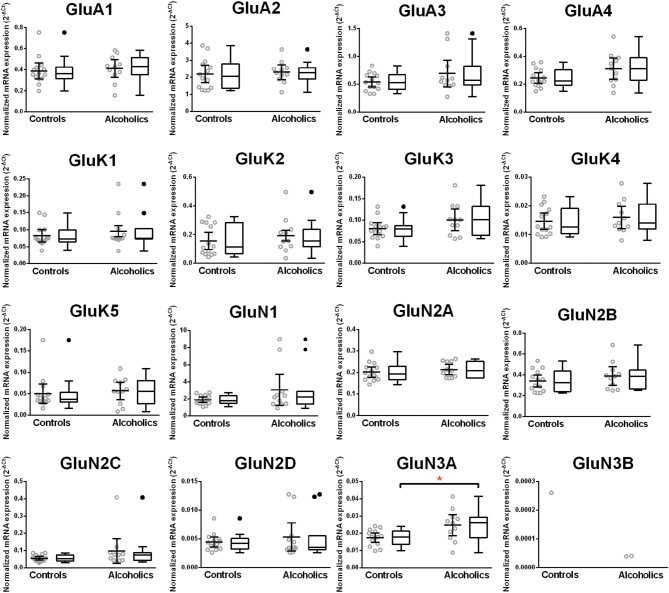
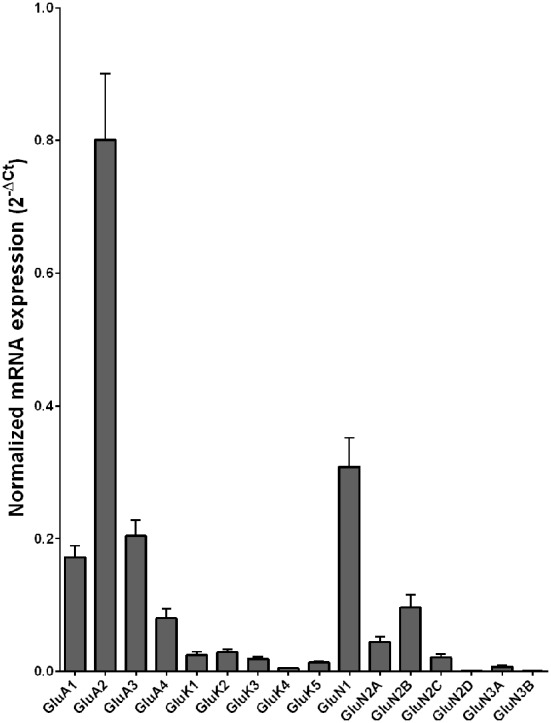
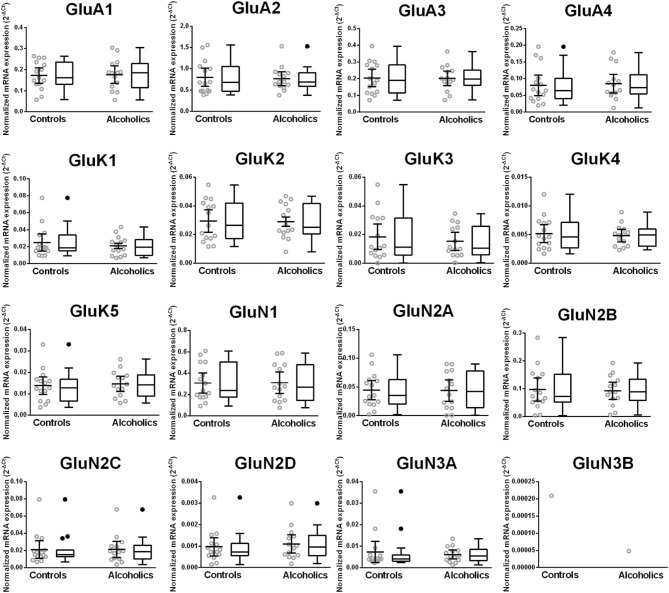
Glutamate is the main excitatory transmitter in the human brain. Drugs that affect the glutamatergic signaling will alter neuronal excitability. Ethanol inhibits glutamate receptors. We examined the expression level of glutamate receptor subunit mRNAs in human post-mortem samples from alcoholics and compared the results to brain samples from control subjects. RNA from hippocampal dentate gyrus (HP-DG), orbitofrontal cortex (OFC), and dorso-lateral prefrontal cortex (DL-PFC) samples from 21 controls and 19 individuals with chronic alcohol dependence were included in the study. Total RNA was assayed using quantitative RT-PCR. Out of the 16 glutamate receptor subunits, mRNAs encoding two AMPA [2-amino-3-(3-hydroxy-5-methyl-isoxazol-4-yl)propanoic acid] receptor subunits GluA2 and GluA3; three kainate receptor subunits GluK2, GluK3 and GluK5 and five NMDA (N-methyl-D-aspartate) receptor subunits GluN1, GluN2A, GluN2C, GluN2D, and GluN3A were significantly increased in the HP-DG region in alcoholics. In the OFC, mRNA encoding the NMDA receptor subunit GluN3A was increased, whereas in the DL-PFC, no differences in mRNA levels were observed. Our laboratory has previously shown that the expression of genes encoding inhibitory GABA-A receptors is altered in the HP-DG and OFC of alcoholics (Jin et al., 2011). Whether the changes in one neurotransmitter system drives changes in the other or if they change independently is currently not known. The results demonstrate that excessive long-term alcohol consumption is associated with altered expression of genes encoding glutamate receptors in a brain region-specific manner. It is an intriguing possibility that genetic predisposition to alcoholism may contribute to these gene expression changes.

Keywords: GluR; ethanol; excitatory; glutamate; glutamate receptor; ion channel.


Figures

Figure 1
Figure 1
Expression of ionotropic glutamate receptor subunit mRNAs in the hippocampal dentate gyrus region from control subjects (n = 15). The mRNA level of each subunit was normalized to reference genes ACTB and UBC and presented as mean ± SEM.
Figure 2
Figure 2
Expression of ionotropic glutamate receptor subunits mRNA in the hippocampal dentate gyrus of controls (n = 15) and alcoholics (n = 13). Data from each group were presented as scatter dot plot (°) with mean and 95% confidence interval and box and whiskers plot with median and whiskers plotted by Tukey method to determine outliers (•-above or below the whiskers). Statistical analysis was performed after excluding outliers. One Way ANOVA with Bonferroni post-hoc test, GluK1, df = 24, p = 0.11; GluN2C, df = 24, p = 0.0084; GluN3A, df = 24, p = 0.012. Kruskal–Wallis ANOVA on ranks with Dunn's post-hoc test, GluA1, H(1, 27) = 0.40, p = 0.53; GluA2, H(1, 27) = 5.09, p = 0.024; GluA3, H(1, 27) = 4.15, p = 0.042; GluA4, H(1, 27) = 0.34, p = 0.56; GluK2, H(1, 28) = 6.77, p = 0.0092; GluK3, H(1, 27) = 5.65, p = 0.017; GluK4, H(1, 28) = 3.14, p = 0.076; GluK5, H(1, 27) = 8.29, p = 0.0040; GluN1, H(1, 28) = 11.46, p = 0.0007; GluN2A, H(1, 28) = 4.59, p = 0.032; GluN2B, H(1, 27) = 3.58, p = 0.058; GluN2D, H(1, 27) = 5.95, p = 0.015. *p < 0.05; **p < 0.01; ***p < 0.001.
Figure 3
Figure 3
Expression of ionotropic glutamate receptor subunit mRNAs in the orbitofrontal cortex of controls (n = 14). The mRNA level of each subunit was normalized to reference genes PPIA and PGK1 and presented as mean ± SEM.
Figure 4
Figure 4
Expression of ionotropic glutamate receptor subunits mRNA in the orbitofrontal cortex of controls (n = 15) and alcoholics (n = 14). Data from each group were presented as scatter dot plot (°) with mean and 95% confidence interval and box and whiskers plot with median and whiskers plotted by Tukey method to determine outliers (•-above or below the whiskers). Statistical analysis was performed after excluding outliers. One Way ANOVA with Bonferroni post-hoc test, GluA1, df = 20, p = 0.31; GluA2, df = 20, p = 0.71; GluA4, df = 20, p = 0.25; GluK4, df = 20, p = 0.99; GluK5, df = 20, p = 0.15; GluN1, df = 20, p = 0.96; GluN2A, df = 20, p = 0.56; GluN2B, df = 20, p = 0.23; GluN2D, df = 20, p = 0.38; GluN3A, df = 20, p = 0.017. Kruskal–Wallis ANOVA on ranks with Dunn's post-hoc test, GluA3, H(1, 24) = 0.28, p = 0.60; GluK1, H(1, 23) = 0.10, p = 0.75; GluK2, H(1, 24) = 0.28, p = 0.60; GluK3, H(1, 24) = 3.55, p = 0.06; GluN2C, H(1, 24) = 0.99, p = 0.32. *p < 0.05.
Figure 5
Figure 5
Expression of ionotropic glutamate receptor subunit mRNAs in the prefrontal cortex of controls (n = 15). The mRNA level of each subunit was normalized to reference genes ACTB and RPLP0 and presented as mean ± SEM.
Figure 6
Figure 6
Expression of ionotropic glutamate receptor subunits mRNA in the prefrontal cortex of controls (n = 14) and alcoholics (n = 11). Data from each group were presented as scatter dot plot (°) with mean and 95% confidence interval and box and whiskers plot with median and whiskers plotted by Tukey method to determine outliers (•-above or below the whiskers). Statistical analysis was performed after excluding outliers. One Way ANOVA with Bonferroni post-hoc test, GluA1, df = 23, p = 0.92; GluA3, df = 23, p = 0.91; GluK2, df = 23, p = 0.67; GluK4, df = 23, p = 0.52; GluK5, df = 23, p = 0.38; GluN2A, df = 23, p = 0.84; GluN2B, df = 23, p = 0.59; GluN2C, df = 23, p = 0.23; GluN2D, df = 23, p = 0.54. Kruskal–Wallis ANOVA on ranks with Dunn's post-hoc test, GluA2, H(1, 28) = 0.26, p = 0.87; GluA4, H(1, 28) = 0.54, p = 0.46; GluK1, H(1, 28) = 0.0021, p = 0.96; GluK3, H(1, 29) = 0.12, p = 0.73; GluN1, H(1, 29) = 0.0019, p = 0.97; GluN3A, H(1, 27) = 1.59, p = 0.21.

References

    1. Acosta G., Freidman D. P., Grant K. A., Hemby S. E. (2011). Alternative splicing of AMPA subunits in prefrontal cortical fields of cynomolgus monkeys following chronic ethanol self-administration. Front. Psychiatry 2:72 10.3389/fpsyt.2011.00072 - DOI - PMC - PubMed
    1. Bazov I., Kononenko O., Watanabe H., Kuntic V., Sarkisyan D., Taqi M. M., et al. (2011). The endogenous opioid system in human alcoholics: molecular adaptations in brain areas involved in cognitive control of addiction. Addict. Biol. 18, 161–169 10.1111/j.1369-1600.2011.00366.x - DOI - PubMed
    1. Blitzer R. D., Gil O., Landau E. M. (1990). Long-term potentiation in rat hippocampus is inhibited by low concentrations of ethanol. Brain Res. 537, 203–208 10.1016/0006-8993(90)90359-J - DOI - PubMed
    1. Bowen C. A., Gatto G. J., Grant K. A. (1997). Assessment of the multiple discriminative stimulus effects of ethanol using an ethanol-pentobarbital-water discrimination in rats. Behav. Pharmacol. 8, 339–352 10.1097/00008877-199708000-00007 - DOI - PubMed
    1. Chandrasekar R. (2013). Alcohol and NMDA receptor: current research and future direction. Front. Mol. Neurosci. 6:14 10.3389/fnmol.2013.00014 - DOI - PMC - PubMed