. 2014 Feb 11;9(2):e83871.
doi: 10.1371/journal.pone.0083871. eCollection 2014.

Ablation of the proapoptotic genes CHOP or Ask1 does not prevent or delay loss of visual function in a P23H transgenic mouse model of retinitis pigmentosa

Affiliations

Ablation of the proapoptotic genes CHOP or Ask1 does not prevent or delay loss of visual function in a P23H transgenic mouse model of retinitis pigmentosa

Adeseye Adekeye et al. PLoS One. .

Abstract

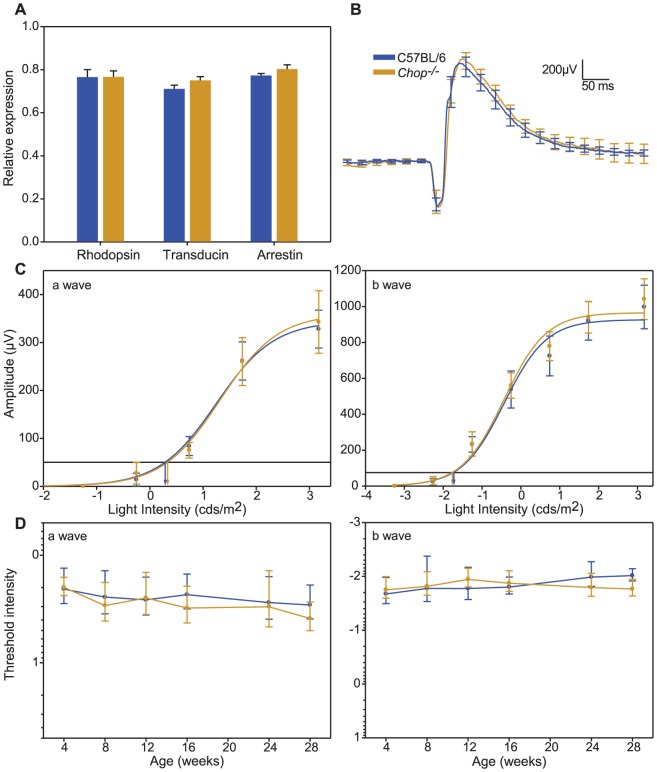
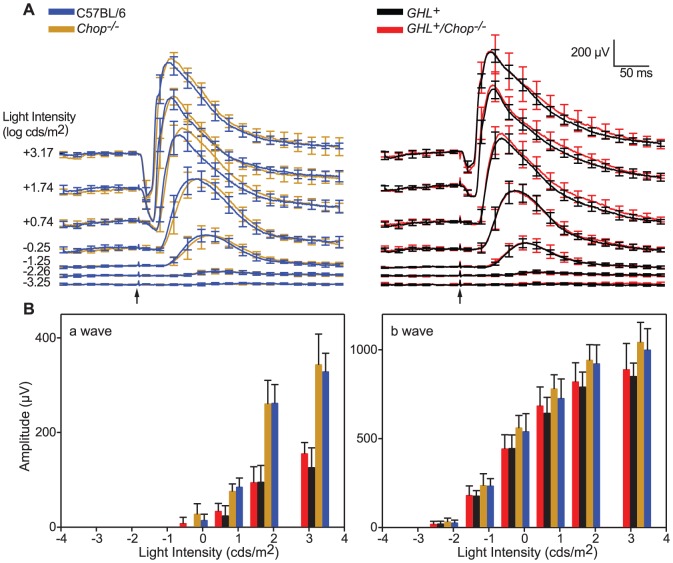
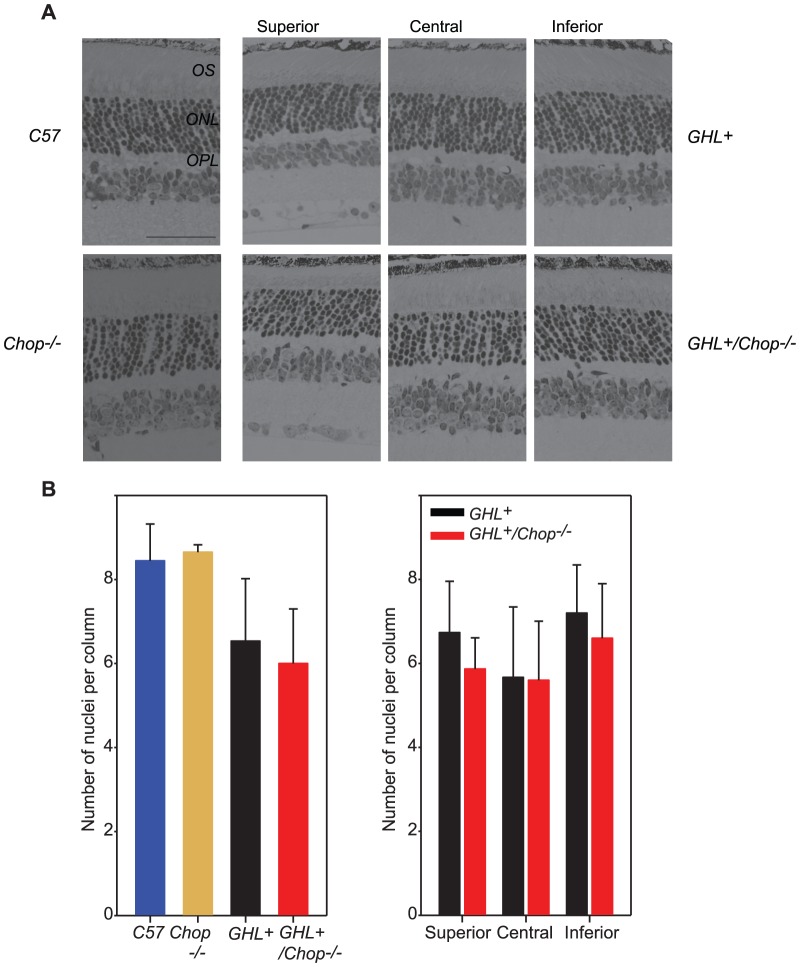
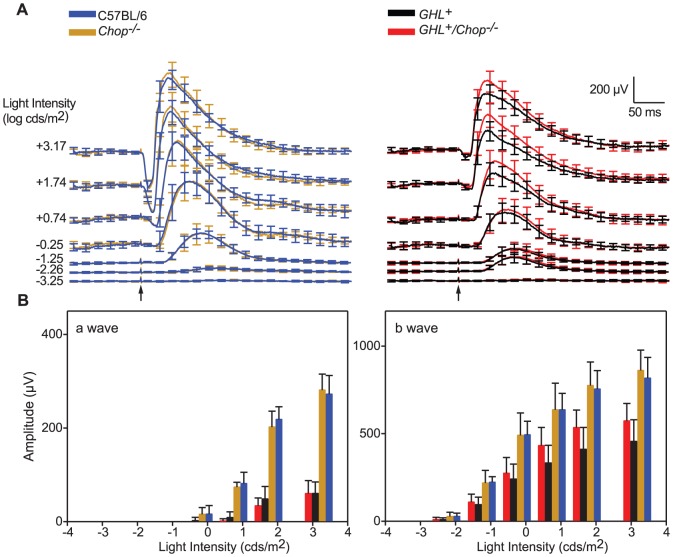
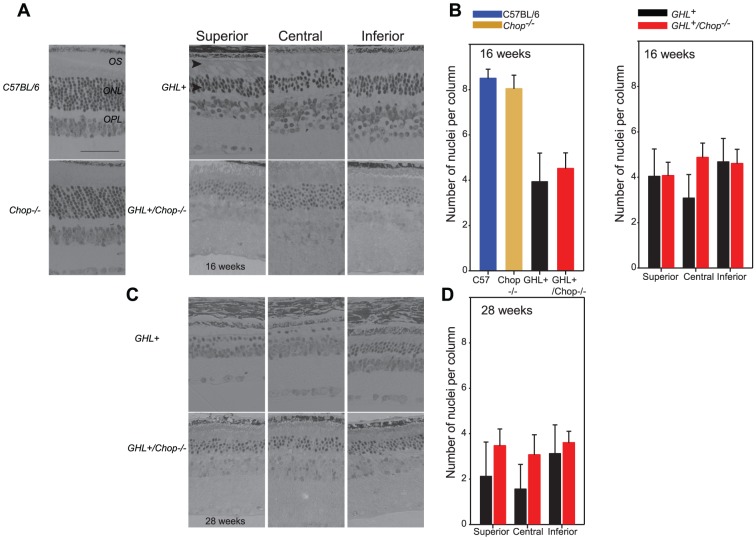
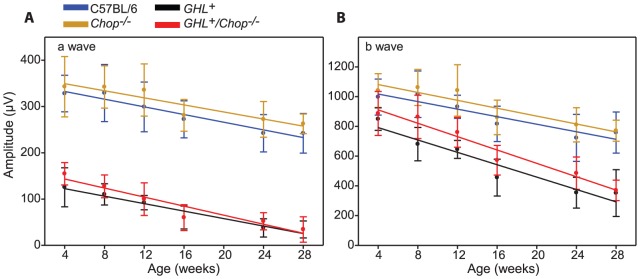
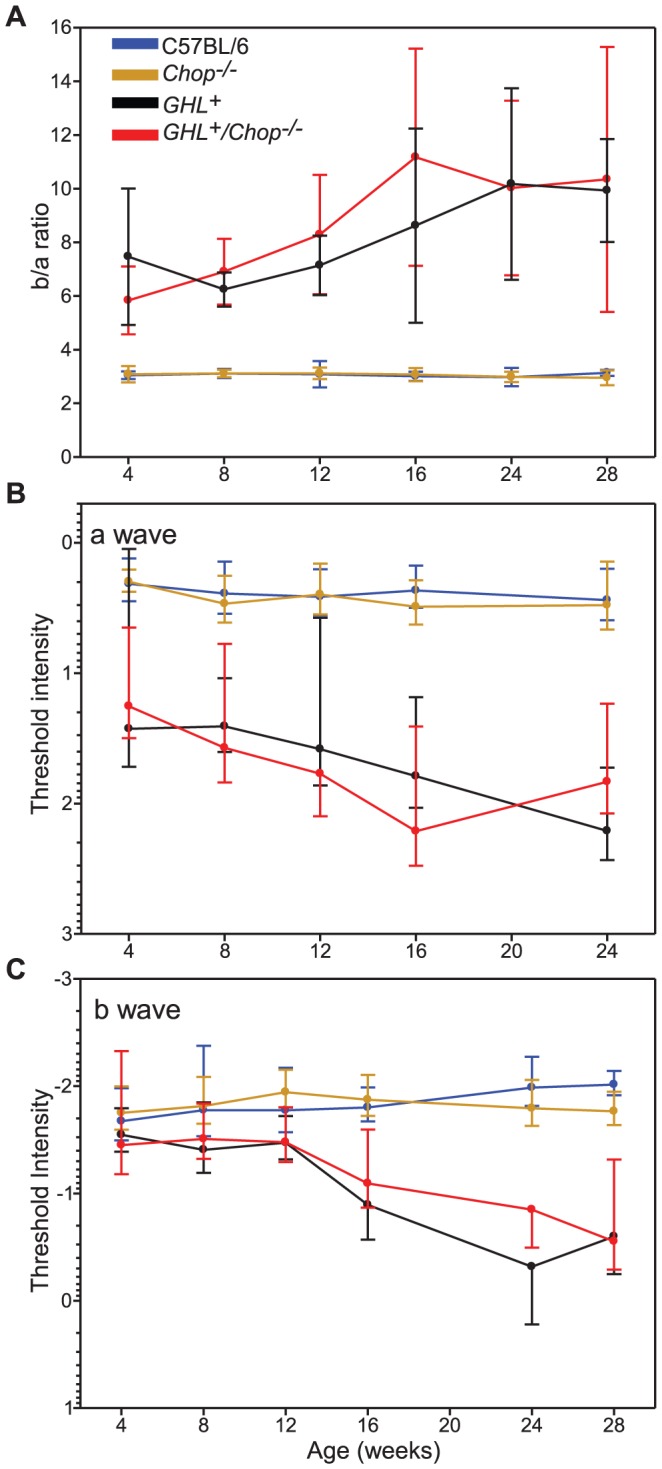
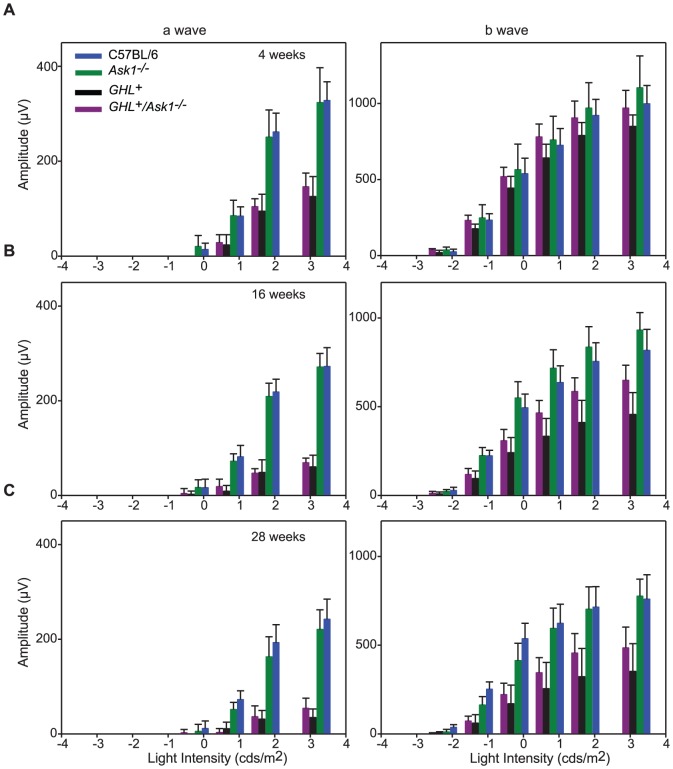
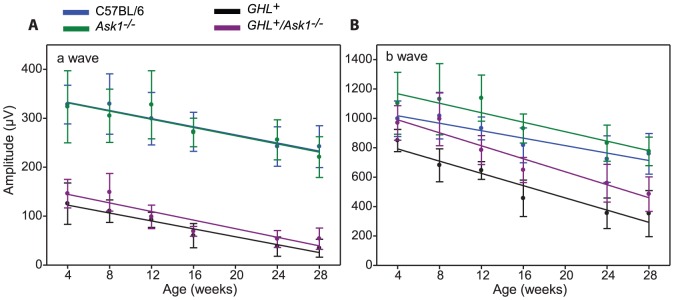
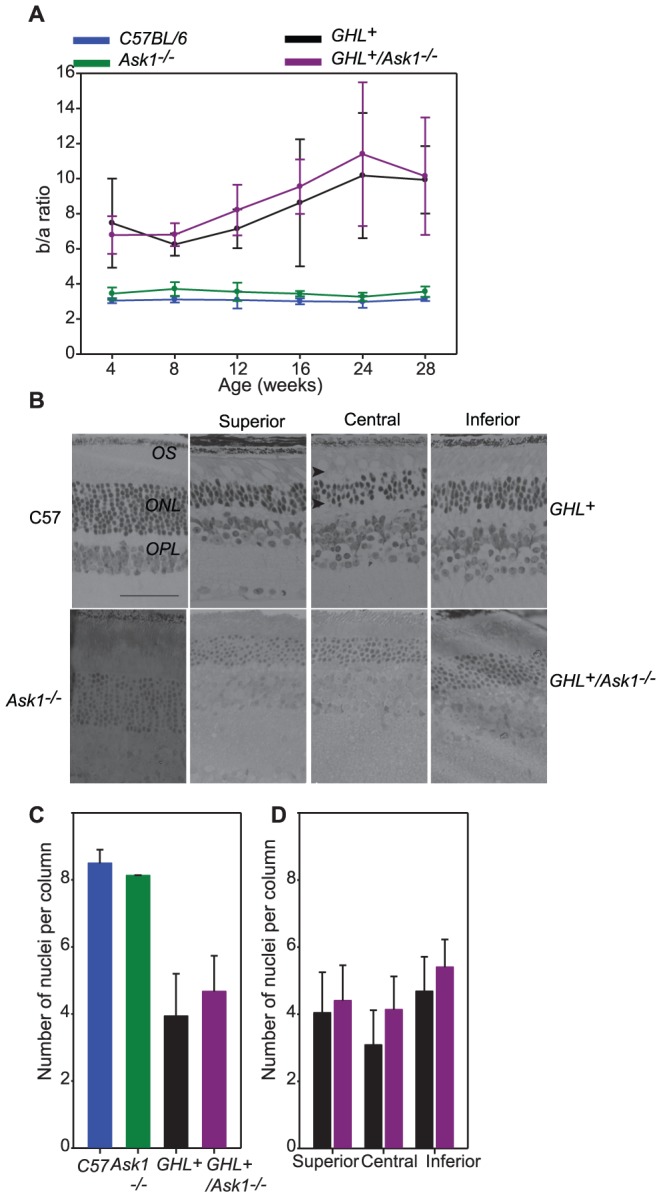
The P23H mutation in rhodopsin (Rho(P23H)) is a prevalent cause of autosomal dominant retinitis pigmentosa. We examined the role of the ER stress proteins, Chop and Ask1, in regulating the death of rod photoreceptors in a mouse line harboring the Rho(P23H) rhodopsin transgene (GHL(+)). We used knockout mice models to determine whether Chop and Ask1 regulate rod survival or retinal degeneration. Electrophysiological recordings showed similar retinal responses and sensitivities for GHL(+), GHL(+)/Chop(-/-) and GHL(+)/Ask1(-/-) animals between 4-28 weeks, by which time all three mouse lines exhibited severe loss of retinal function. Histologically, ablation of Chop and Ask1 did not rescue photoreceptor loss in young animals. However, in older mice, a regional protective effect was observed in the central retina of GHL(+)/Chop(-/-) and GHL(+)/Ask1(-/-), a region that was severely degenerated in GHL(+) mice. Our results show that in the presence of the Rho(P23H) transgene, the rate of decline in retinal sensitivity is similar in Chop or Ask1 ablated and wild-type retinas, suggesting that these proteins do not play a major role during the acute phase of photoreceptor loss in GHL(+) mice. Instead they may be involved in regulating secondary pathological responses such as inflammation that are upregulated during later stages of disease progression.


Conflict of interest statement

Competing Interests: The authors have declared that no competing interests exist.

Figures

Figure 1
Figure 1. Effect of Chop on the expression of phototransduction genes and visual function.
(A). Quantitative RT-PCR analysis of 4 week old C57BL/6 and Chop−/− mice (n = 4). Samples were normalized to β-actin levels. (B). Average scotopic ERG a- and b-wave waveforms from 4 week old C57BL/6 (blue trace) and Chop−/− (orange trace) mice in response to 1 ms flashes (n = 7–9). (C) Intensity-response functions of a- and b-waves recorded from the same C57BL/6 and Chop−/− mice. Horizontal lines and vertical intercepts on the abscissa (a-wave It: 50 µV, b-wave It: 75 µV) show the method used to determine threshold light intensities (It). (D) Age related changes in a- and b-wave threshold light intensities in C57BL/6 and Chop−/− mice. Error bars are ± SD.
Figure 2
Figure 2. ERG responses in 4 week old GHL+ and GHL+/Chop−/− mice.
(A) Average scotopic ERG a- and b-wave waveforms from C57BL/6 (blue traces), Chop−/− (orange traces) GHL+ (black traces) and GHL+/Chop−/− (red traces) mice in response to 1 ms flashes of increasing intensity, from bottom to top, (n = 7–9). (B) Intensity-response functions of a- and b-waves. Error bars: ± SD. Scale bar: x = 50 ms, y = 200 µV. Arrows represent the onset of light stimulus.
Figure 3
Figure 3. Histological analysis of 4 week old GHL+ and GHL+/Chop−/− retinas.
(A) Representative sections of retinas from 4 week old C57BL/6, Chop−/−, GHL+ and GHL+/Chop−/− mice (n = 2–3). (B) Mean number of photoreceptor nuclei per column counted in the ONL (left panel), and the variance in the number of photoreceptor nuclei per column counted in different zones of the retina in GHL+ and GHL+/Chop−/− mice, (right panel). Superior zone: 630 µm from the CMZ, central zone: 630 µm from optic nerve, and inferior zone: midpoint of inferior hemisphere. Error bars: ± SD OPL: outer plexiform layer, ONL: outer nuclear layer, OS: outer segment. Scale bar, 50 µm.
Figure 4
Figure 4. ERG responses in 16 week old GHL+ and GHL+/Chop−/− mice.
(A) Average scotopic ERG a- and b-wave waveforms from C57BL/6 (blue traces), Chop−/− (orange traces) GHL+ (black traces) and GHL+/Chop−/− (red traces) mice in response to 1 ms flashes of increasing intensity, from bottom to top, (n = 8–13). (B) Intensity-response functions of a- and b-waves. Error bars ± SD. Scale bar: x = 50 ms, y = 200 µV. Arrows represent the onset of light stimulus.
Figure 5
Figure 5. Histological analysis of 16 and 28 week old GHL+ and GHL+/Chop−/− mice.
(A) Representative sections of retinas from 16 week old C57BL/6, Chop−/−, GHL+ and GHL+/Chop−/− mice. GHL+ and GHL+/Chop−/− retinas had shortened OS (arrowheads). (B, right panel) Mean number of photoreceptor nuclei per column counted in the ONL at 16 weeks. The variance in the number of photoreceptor nuclei per column counted in different zones of the retina in (B, left panel) in 16 week. (C) Representative sections of retinas from 28 week old GHL+ and GHL+/Chop−/− mice. (D) The variance in the number of photoreceptor nuclei per column counted in different zones of the retina in 28 week old GHL+ and GHL+/Chop−/− mice. Superior zone: 630 µm from the CMZ, central zone: 630 µm from optic nerve, and inferior zone: midpoint of inferior hemisphere. Error bars: ± SD OPL: outer plexiform layer, ONL: outer nuclear layer, OS: outer segment. Scale bar 50 µm.
Figure 6
Figure 6. ERG changes as a function of age in GHL+ and GHL+/Chop−/− mice.
Maximal a- and b-wave amplitudes as a function of age in C57BL/6 (blue trace), Chop−/− (orange trace) GHL+ (black trace) and GHL+/Chop−/− (red trace) mice. Colored lines are polynomial fits.
Figure 7
Figure 7. Age related changes in retinal function and sensitivity of GHL+ and GHL+/Chop−/− mice.
(A) b/a wave ratio in C57BL/6, Chop−/−, GHL+, and GHL+/Chop−/− mice. (B and C) Age related changes in a- and b-wave threshold intensities in C57BL/6, Chop−/−, GHL+, and GHL+/Chop−/− mice (a- wave It = 50 µV, b- wave It = 75 µV). Error bars: ± SD.
Figure 8
Figure 8. ERG responses in GHL+ and GHL+/Ask1−/− mice.
Intensity-response functions of a- and b-waves in (A) 4, (B) 16, and (C) 28 week old C57BL/6 (blue), Ask1−/− (green) GHL+ (black) and GHL+/Ask1−/− (purple) mice (n = 7–14). Error bars: ± SD.
Figure 9
Figure 9. Rate of retinal degeneration in GHL+ and GHL+/Ask1−/− mice.
Maximal a- and b-wave amplitudes as a function of age in C57BL/6 (blue), Ask1−/− (green) GHL+ (black) and GHL+/Ask1−/− (purple) mice. Error bars: ± SD. Colored lines are polynomial fits.
Figure 10
Figure 10. Age related changes in retinal function and morphology of GHL+ and GHL+/Ask1−/− mice.
(A) b/a wave ratio in C57BL/6, Ask1−/−, GHL+, and GHL+/Ask1−/− mice. (B) Representative sections of retinas from 16 week old C57BL/6, Ask1−/−, GHL+ and GHL+/Ask1−/− mice. GHL+ and GHL+/Ask1−/− retinas had shortened OS (arrowheads). (C) Mean number of photoreceptor nuclei per column counted in the ONL. Error bars: ± SD. OPL: outer plexiform layer, ONL: outer nuclear layer, OS: outer segment. Scale bar 50 µm. (D) The variance in the number of photoreceptor nuclei per column counted in different zones of the retina in GHL+ and GHL+/Ask1−/− mice, (right panel). Superior zone: 630 µm from the CMZ, central zone: 630 µm from optic nerve, and inferior zone: midpoint of inferior hemisphere.

References

    1. Hartong DT, Berson EL, Dryja TP (2006) Retinitis pigmentosa. Lancet 368: 1795–1809. - PubMed
    1. Bunker CH, Berson EL, Bromley WC, Hayes RP, Roderick TH (1984) Prevalence of retinitis pigmentosa in Maine. Am J Ophthalmol 97: 357–365. - PubMed
    1. Grondahl J (1987) Estimation of prognosis and prevalence of retinitis pigmentosa and Usher syndrome in Norway. Clin Genet 31: 255–264. - PubMed
    1. Papermaster DS, Dreyer WJ (1974) Rhodopsin content in the outer segment membranes of bovine and frog retinal rods. Biochemistry 13: 2438–2444. - PubMed
    1. Mendes HF, van der Spuy J, Chapple JP, Cheetham ME (2005) Mechanisms of cell death in rhodopsin retinitis pigmentosa: implications for therapy. Trends Mol Med 11: 177–185. - PubMed

Publication types