

DiME: a scalable disease module identification algorithm with application to glioma progression
- PMID: 24523864
- PMCID: PMC3921127
- DOI: 10.1371/journal.pone.0086693
DiME: a scalable disease module identification algorithm with application to glioma progression
Abstract
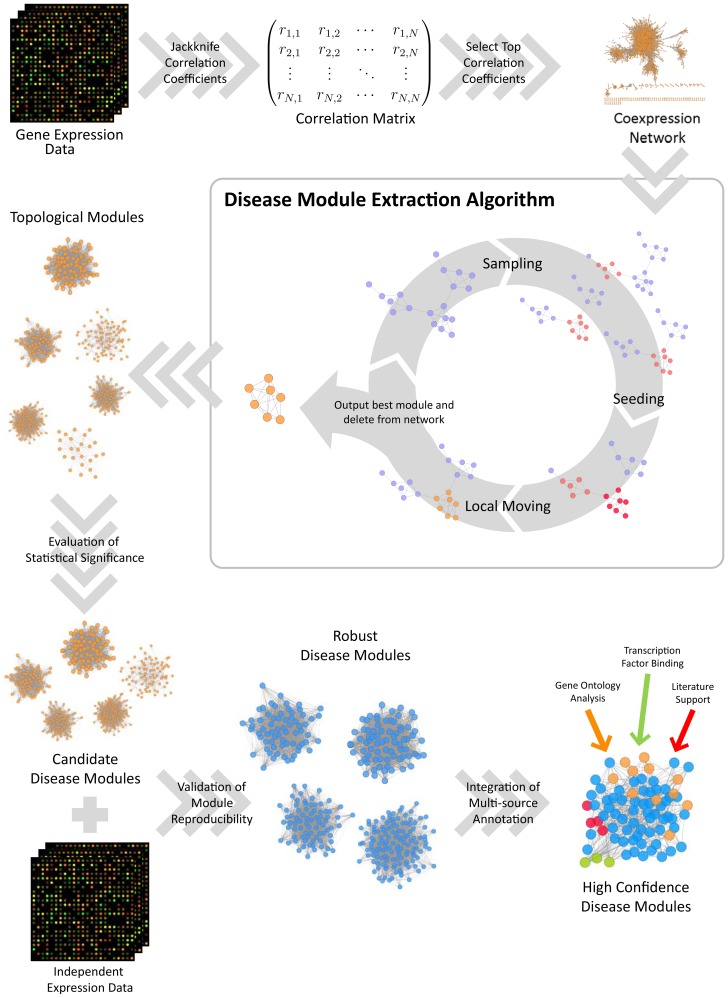
Disease module is a group of molecular components that interact intensively in the disease specific biological network. Since the connectivity and activity of disease modules may shed light on the molecular mechanisms of pathogenesis and disease progression, their identification becomes one of the most important challenges in network medicine, an emerging paradigm to study complex human disease. This paper proposes a novel algorithm, DiME (Disease Module Extraction), to identify putative disease modules from biological networks. We have developed novel heuristics to optimise Community Extraction, a module criterion originally proposed for social network analysis, to extract topological core modules from biological networks as putative disease modules. In addition, we have incorporated a statistical significance measure, B-score, to evaluate the quality of extracted modules. As an application to complex diseases, we have employed DiME to investigate the molecular mechanisms that underpin the progression of glioma, the most common type of brain tumour. We have built low (grade II)--and high (GBM)--grade glioma co-expression networks from three independent datasets and then applied DiME to extract potential disease modules from both networks for comparison. Examination of the interconnectivity of the identified modules have revealed changes in topology and module activity (expression) between low- and high- grade tumours, which are characteristic of the major shifts in the constitution and physiology of tumour cells during glioma progression. Our results suggest that transcription factors E2F4, AR and ETS1 are potential key regulators in tumour progression. Our DiME compiled software, R/C++ source code, sample data and a tutorial are available at http://www.cs.bham.ac.uk/~szh/DiME.
Conflict of interest statement
Figures
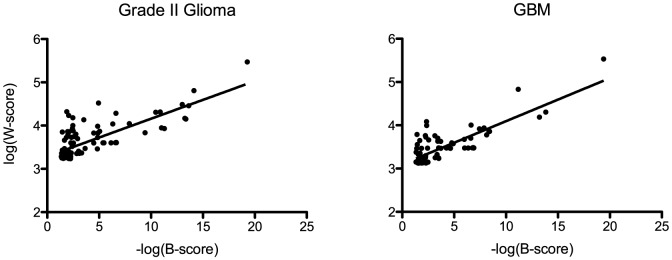
 are included. A few modules whose B-score is 0 (indicating scores exceeding the lower limit of detection in the B-score algorithm) were excluded. Fitted lines of
  versus
  are shown. The fitted Pearson's correlation
  values are 0.57 (grade II glioma, left panel) and 0.65 (GBM, right panel) respectively, with both correlation
  values smaller than 0.0001 in Pearson's correlation tests.
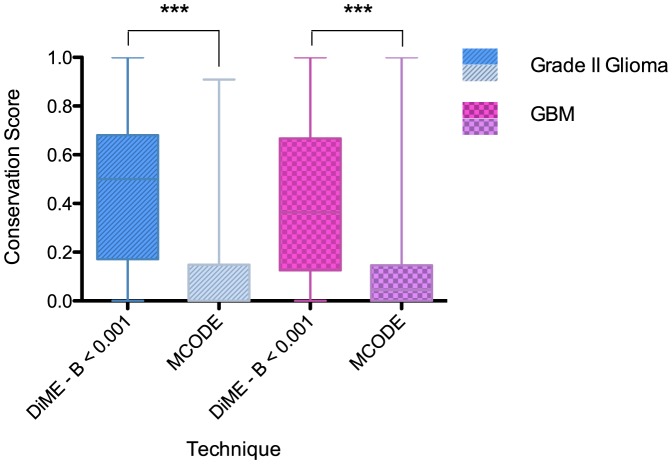
 -tests when comparing means with MCODE modules: “***” -
  .
.
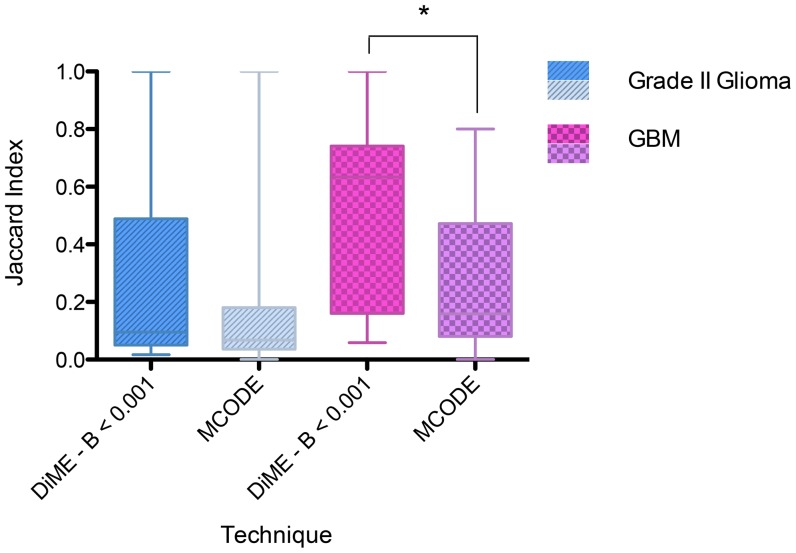
 -tests when comparing means with MCODE modules: “*” -
  .
.
References
-
- Barabási AL, Oltvai ZN (2004) Network biology: understanding the cell's functional organization. Nature Reviews Genetics 5: 101–113. - PubMed
Publication types
MeSH terms
LinkOut - more resources
Full Text Sources
Other Literature Sources
Medical
Research Materials
Miscellaneous
