. 2014 Feb 11;9(2):e87610.
doi: 10.1371/journal.pone.0087610. eCollection 2014.

SYK allelic loss and the role of Syk-regulated genes in breast cancer survival

Affiliations

SYK allelic loss and the role of Syk-regulated genes in breast cancer survival

Jan Blancato et al. PLoS One. .

Abstract

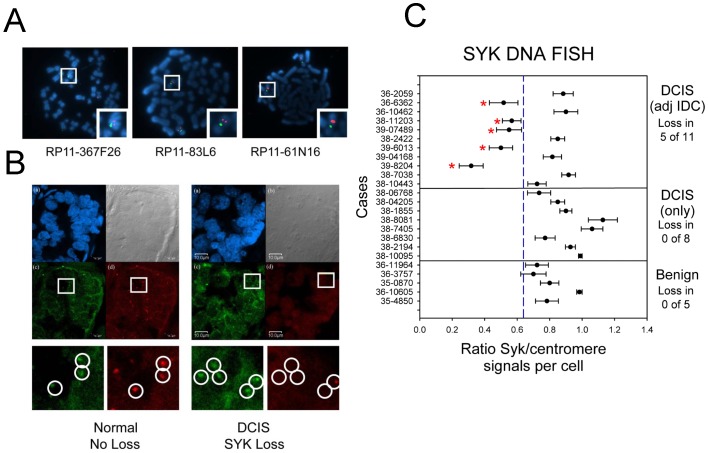
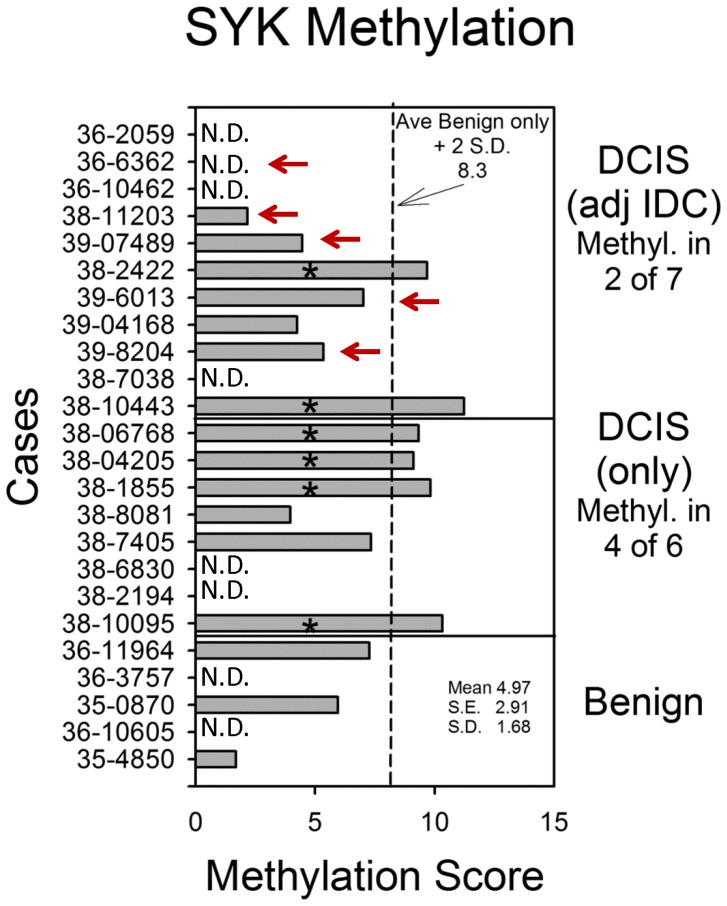
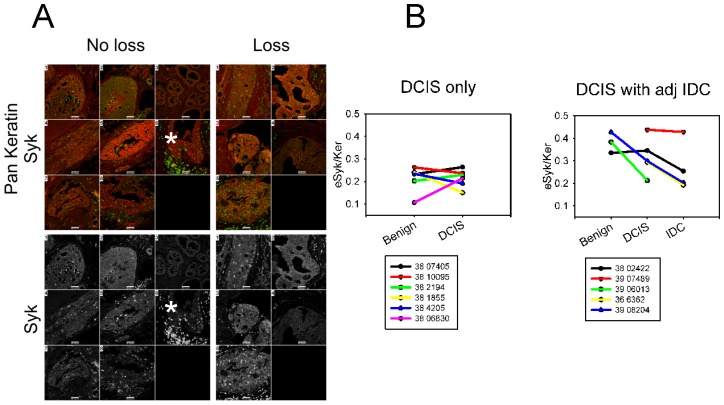
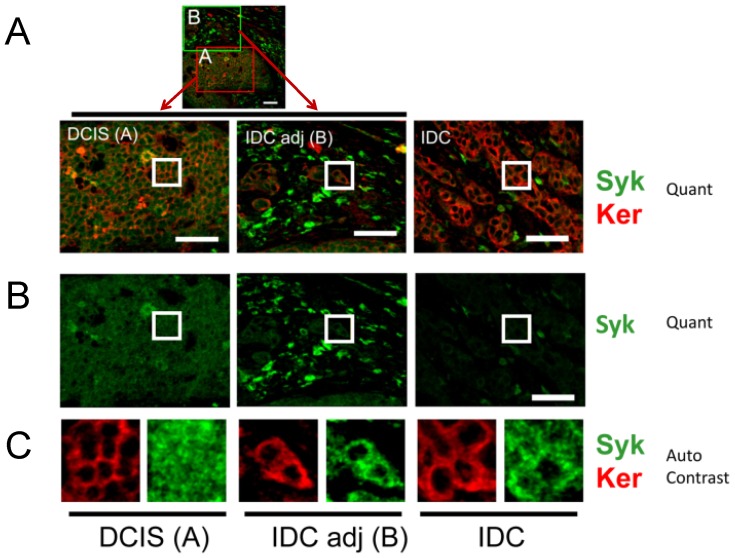
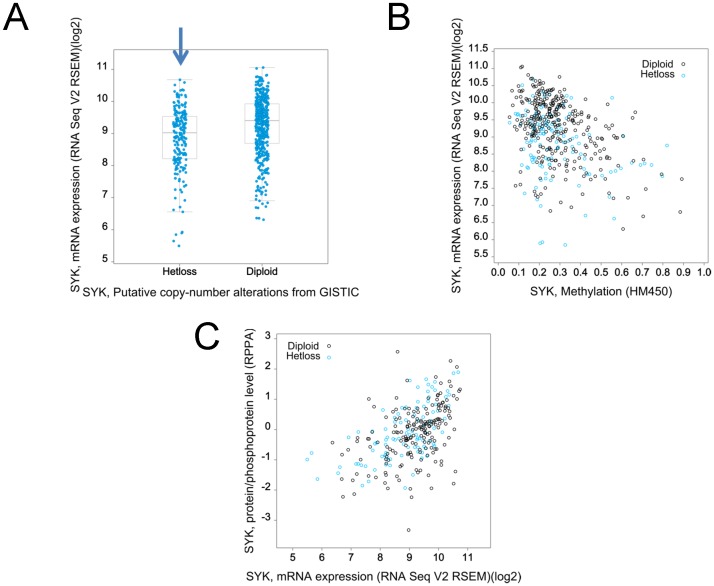
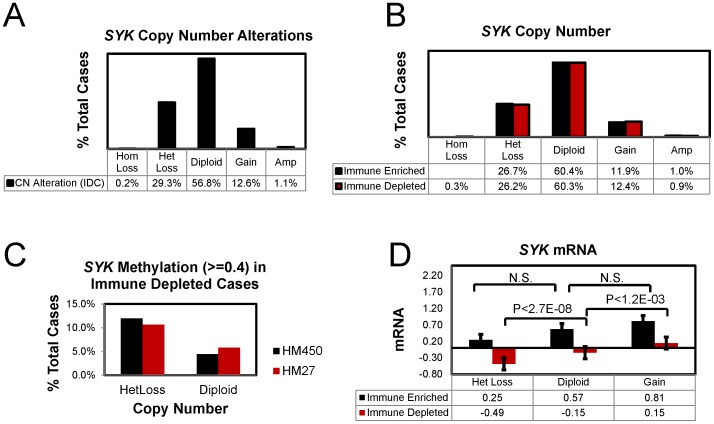
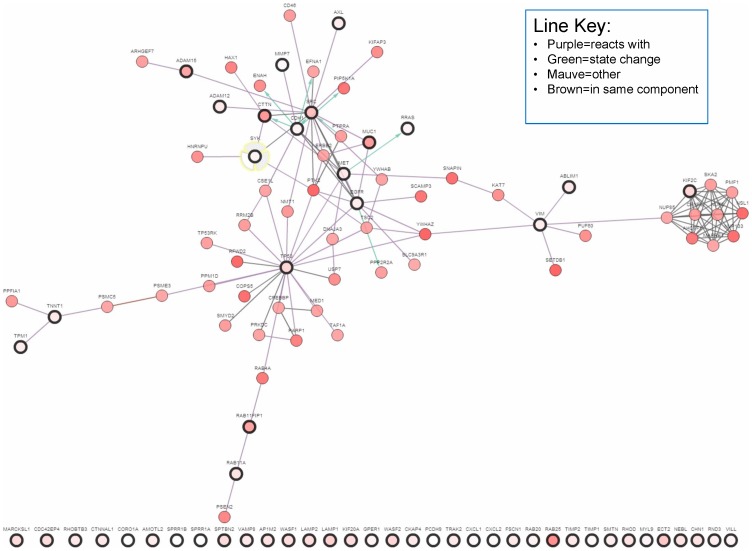
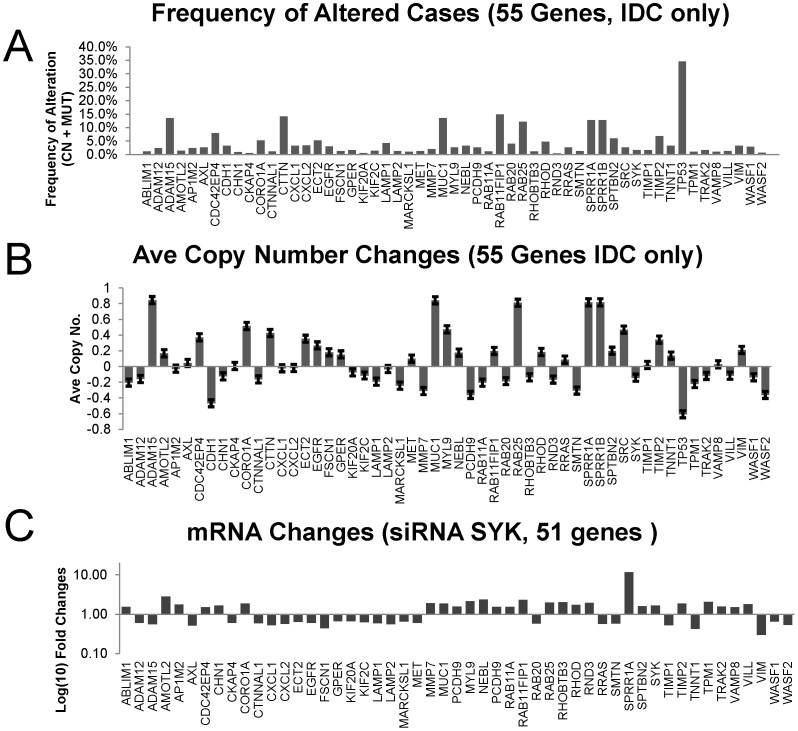
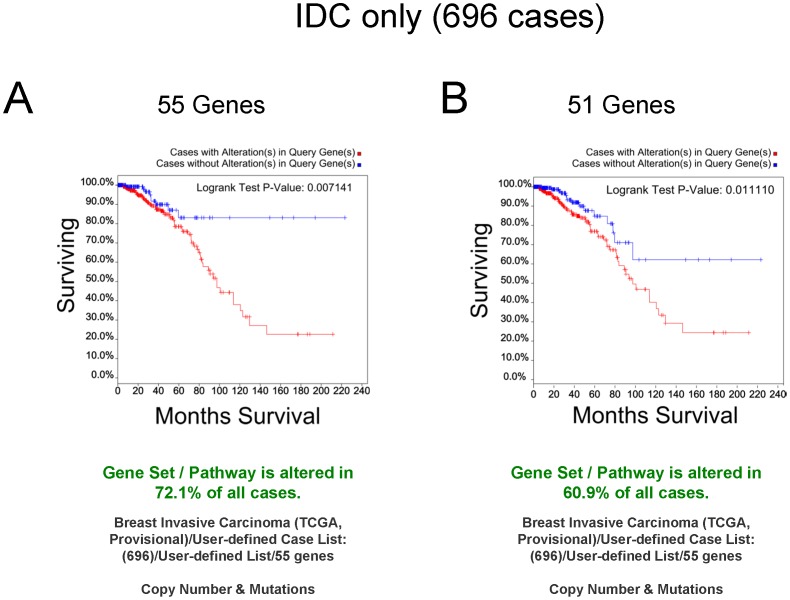
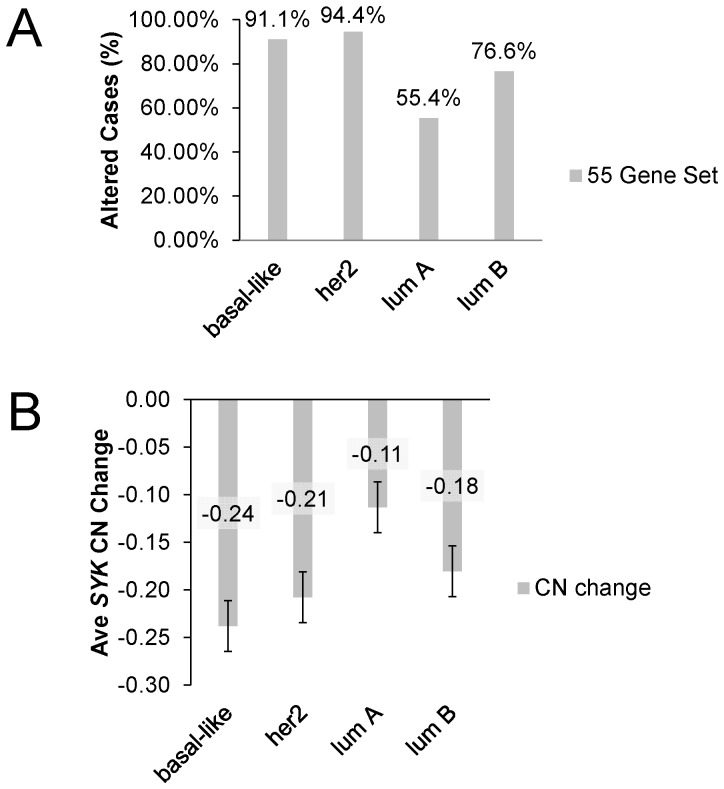
Heterozygotic loss of SYK, a non-receptor tyrosine kinase, gives rise to mouse mammary tumor formation where Syk protein levels are reduced by about half; loss of SYK mRNA is correlated with invasive cell behavior in in vitro models; and SYK loss has been correlated with distant metastases in patients. Here, allelic loss of the SYK gene was explored in breast ductal carcinoma in situ (DCIS) using fluorescence in situ hybridization and pyrosequencing, respectively, and in infiltrating ductal carcinoma (IDC) using genomic data from The Cancer Genome Atlas (TCGA). Allelic loss was present in a subset of DCIS cases where adjacent IDC was present. SYK copy number loss was found in about 26% of 1002 total breast cancer cases and 30% of IDC cases. Quantitative immunofluorescence revealed Syk protein to be six-fold higher in infiltrating immune cells compared with epithelial cells. This difference distorted tumor cell mRNA and protein levels in extracts. 20% of 1002 IDC cases contained elevated immune cell infiltration as estimated by elevated immune-specific mRNAs. In cases without immune cell infiltration, loss of SYK copy number was associated with a significant reduction of SYK mRNA. Here we define a 55 Gene Set consisting of Syk interacting, motility- and invasion-related genes. We found that overall survival was significantly reduced in IDC and Luminal A+B cases where copy number and mutations of these 55 genes were affected (Kaplan-Meier, Logrank test p-value 0.007141 and Logrank test p-value 0.001198, respectively). We conclude that reduction in Syk expression and contributions of genomic instability to copy number and mutations in the 55 Syk interacting genes significantly contribute to poorer overall patient survival. A closer examination of the role of Syk interacting motility and invasion genes and their prognostic and/or causative association with metastatic disease and patient outcome is warranted.


Conflict of interest statement

Competing Interests: The authors have declared that no competing interests exist.

Figures

Figure 1
Figure 1. DNA FISH Analysis.
A. Normal control metaphase spreads were used to validate the SYK probe (chromosome 9). The centromeric probe for chromosome 9 is green and the probe for SYK is red. Each BAC was labeled with Spectrum Orange™ (a) RP11-367F26, (b) RP11-83L6, (c) RP11-61N16. B. Confocal microscopy imaging of FISH slides. The panel at left is an example of normal mammary tissue and the panel at right is of DCIS tissue with SYK gene loss. In both, (a) DAPI-stained nuclei, (b) differential interference contrast imaging of section, (c) SYK FISH signal (green), (d) chromosome 9 centromere signal (red). C. The mean value for the ratio of SYK/chromosome 9 centromere signals for each case is illustrated in a bar plot for benign only, DCIS only, and DCIS with adjacent IDC samples. The mean was determined for each case from the ratios obtained individually from 30 cells. Error bars indicate S.E. of the mean. The mean SYK/control ratio of the combined cases was 0.92+/−0.048 S.E. for DCIS only tissues and 0.70+/−0.057 S.E. for DCIS adjacent to IDC cases. The mean for benign only tissues was 0.80+/−0.050 S.E.. The ANOVA P value for the three tissues was 0.035.
Figure 2
Figure 2. SYK promoter methylation.
The mean value for promoter methylation at 4 CpG islands was plotted for each case. DCIS cases are arranged by whether adjacent IDC was absent or present, and benign only cases are shown for comparison (mean 4.97+/−1.68 S.D., 2.91 S.E.). The dashed line indicates the mean of the benign cases plus 2 S.D. (8.3). Red arrows indicate cases where FISH identified allelic loss.
Figure 3
Figure 3. Immunofluorescence staining of DCIS tissues.
A. Immunofluorescence confocal images of ductal carcinoma in situ (DCIS) tissues from 8 cases with no allelic loss determined by DNA FISH (unless otherwise indicated, DCIS with adjacent IDC): 1) 38 002422 (methylated), 2) 38 06830 (DCIS only, methylation status unknown), 3) 38 10095 (DCIS only, methylated), 4) 38 2194 3 (DCIS only, methylation status unknown), 5) 38 4205 (DCIS only, methylated), 6) 38 7405 A5 (DCIS only, not methylated), 7) 38 8081 8 (DCIS only, not methylated), 8) 39 04168 (not methylated) and 5 cases of DCIS with allelic loss determined by DNA FISH (all DCIS with adjacent IDC: 1) 38 6362, methylation status unknown, 2) 38 11203 (not methylated) 5, 3) 39 06013 (not methylated), 4) 39 07489 (not methylated), 5) 39 08204 (not methylated). Note that anti-Syk staining highlights the presence of a subpopulation of lymphocytes and/or other infiltrating inflammatory cells that is always more intense than tumor epithelium staining (see asterisks). Myoepithelial cells are negative. There was no obvious difference between the intensity of either anti-Syk or anti-pan keratin staining between sections of tissue with or without allelic loss. Scale bars = 50 µm. B. The ratios of eSyk/Ker from individual cases were segregated according to DCIS only versus DCIS with adjacent IDC. DCIS only cases are shown on the left (DCIS) and DCIS with adjacent IDC are shown on the right (DCIS with adj IDC). Data was plotted using eSyk/Ker ratios. All available tissues from each case section were used but were not available for every case. Only cases with two or more tissues present were plotted.
Figure 4
Figure 4. Representative confocal immunofluorescence staining of Syk and keratin in a single case, 36 6362.
Two-color images of Syk and keratin staining (Syk,/Ker Quant) are shown for DCIS and IDC tissues within the same confocal image (low magnification view of DCIS with adjacent IDC: “DCIS (A)” and “IDC adj (B)”). IDC from the same slide but a different field of view is shown (“IDC”). The single color, Syk only staining is shown below (Syk, Quant). The background subtracted images were acquired and presented quantitatively for direct comparison (Quant). To qualitatively compare the localization of Syk and keratin, insets are shown on the bottom panels where brightness and contrast were optimized using the auto-contrast function in Metamorph Offline software (Auto Contrast). Keratin is always cytoplasmic, whereas Syk can also be nuclear. The asterisk highlights an area of immune cell infiltration. Scale bars = 50 µm.
Figure 5
Figure 5. Characterization of the relationship between SYK copy number, mRNA, and protein in immune depleted cases from TCGA Provisional Study.
801 of 1002 breast cancer cases were characterized as immune depleted (see methods) and were used for the following graphs. A. Putative SYK copy number (x-axis) for Diploid and Hetloss is plotted against SYK mRNA in a box plot. The blue arrow indicates the Hetloss group. B. SYK methylation (x-axis) is plotted against SYK mRNA (y-axis) for individual cases of HetLoss or Diploid. Blue circles indicate putative heterozygotic loss and black circles indicate diploid copy number. Dashed line indicates cutoff methylation level. C. SYK mRNA is plotted against Syk protein/phosphoprotein levels for Diploid and Hetloss cases.
Figure 6
Figure 6. Effect of copy number loss of SYK methylation and mRNA expression.
A. Data for IDC cases were extracted using cBioPortal and the percent of cases for each putative copy number category determined (homozygotic deletion (HomLoss, −2), HetLoss (−1), Diploid, Gain (+1), and amplification (Amp, +2). B–D. 1002 invasive breast cancer cases were classified as immune cell depleted (800 cases) or immune cell enriched (202 cases) as described in Methods. B. The percent of cases for each putative copy number category was determined. C. The percent of cases with methylation > = 0.4 using either the HM450 or the HM27 array data were plotted for immune depleted HetLoss and Diploid cases. D. SYK mRNA values for each case were extracted and means + S.E. plotted for each category. Only the differences between HetLoss, Diploid, and Gain for immune depleted cases were significant (ANOVA P value 2E-09). P-values for t-tests assuming unequal variances are shown.
Figure 7
Figure 7. Network interactions amongst the members of the 55 Gene Set.
Heavy black circles indicate members of the 55 Gene Set; additional nodes were added based on most related with highest copy number alterations (cBioPortal tools).
Figure 8
Figure 8. Comparisons of SYK-regulated mRNA changes, average copy numbers, and percent of cases altered.
A. The % altered IDC cases were plotted for each member of the 55 Gene Set. B. The average copy number was plotted for each member of the 55 Gene Set . C. Fold changes in mRNAs (log) of genes regulating motility and invasion following SYK siRNA knockdown in ER-negative, MCF10A breast cells were plotted for 51 mRNA species.
Figure 9
Figure 9. Kaplan-Meier curves of queries of IDC only cases.
A. Survival curves for 696 cases (IDC cases only) from the TCGA Provisional Breast Cancer Study were generated using cBioPortal querying with the 55 Gene Set. 72.1% of all cases were altered (copy number and mutations). The Logrank test p-value was 0.007141. B. The cBioPortal query was repeated using only the 51 genes from the SYK microarray study . 60.9% of all cases were altered (copy number and mutations). The Logrank test p-value was 0.011110.
Figure 10
Figure 10. Stratification of cases by breast cancer subtype and by SYK copy number and frequency of alteration.
A. The % of altered IDC cases was determined using the 55 Gene Set for cases identified as basal-like, her2, luminal A or luminal B using the PAM50 gene set . B. The average SYK copy number change (CN) was determined for cases identified as in A.
Figure 11
Figure 11. Kaplan-Meier curves of queries of Luminal A + Luminal B cases.
A. A query of 295 cases of luminal A and luminal B (as determined in using the PAM50 gene set) from the Provisional Breast Cancer Study was performed using the 55 Gene Set. 64.1% of all cases were altered (copy number and mutations). The Logrank test p-value was 0.001196. B. The cBioPortal query was repeated using the 51 genes from the SYK microarray study . 53.2% of all cases were altered (copy number and mutations). The Logrank test p-value was 0.004582. C. The cBioPortal query was repeated using 4 genes (CDH1, CTTN, SRC, and TP53). 35.6% of all cases were altered (copy number and mutations). The Logrank test p-value was 0.006403.

References

    1. Mocsai A, Ruland J, Tybulewicz VL (2010) The SYK tyrosine kinase: a crucial player in diverse biological functions. Nat Rev Immunol 10: 387–402. - PMC - PubMed
    1. Coopman PJ, Do MT, Barth M, Bowden ET, Hayes AJ, et al. (2000) The Syk tyrosine kinase suppresses malignant growth of human breast cancer cells. Nature 406: 742–747. - PubMed
    1. Sung YM, Xu X, Sun J, Mueller D, Sentissi K, et al. (2009) Tumor Suppressor Function of Syk in Human MCF10A In Vitro and Normal Mouse Mammary Epithelium In Vivo. PLoS ONE 4: e7445. - PMC - PubMed
    1. Moroni M, Soldatenkov V, Zhang L, Zhang Y, Stoica G, et al. (2004) Progressive loss of Syk and abnormal proliferation in breast cancer cells. Cancer Res 64: 7346–7354. - PubMed
    1. Coopman PJ, Mueller SC (2006) The Syk tyrosine kinase: a new negative regulator in tumor growth and progression. Cancer Letters 241: 159–173. - PubMed

Publication types

MeSH terms