. 2014 Feb 11;9(2):e88489.
doi: 10.1371/journal.pone.0088489. eCollection 2014.

ROCK inhibition activates MCF-7 cells

Affiliations

ROCK inhibition activates MCF-7 cells

Seungwon Yang et al. PLoS One. .

Abstract

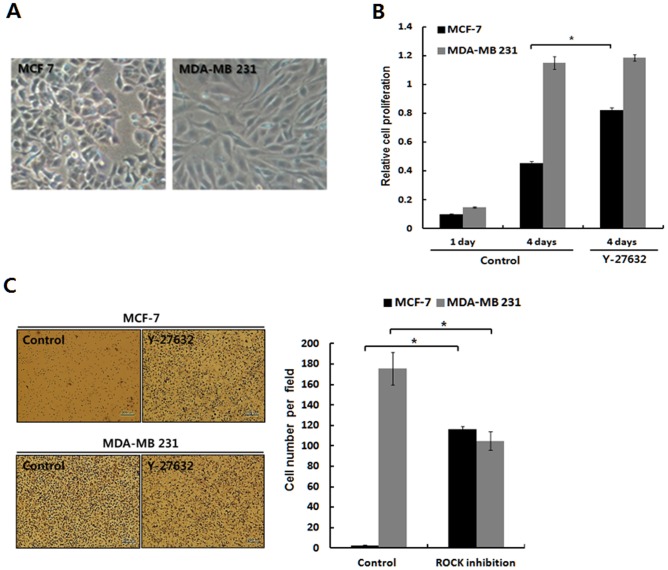
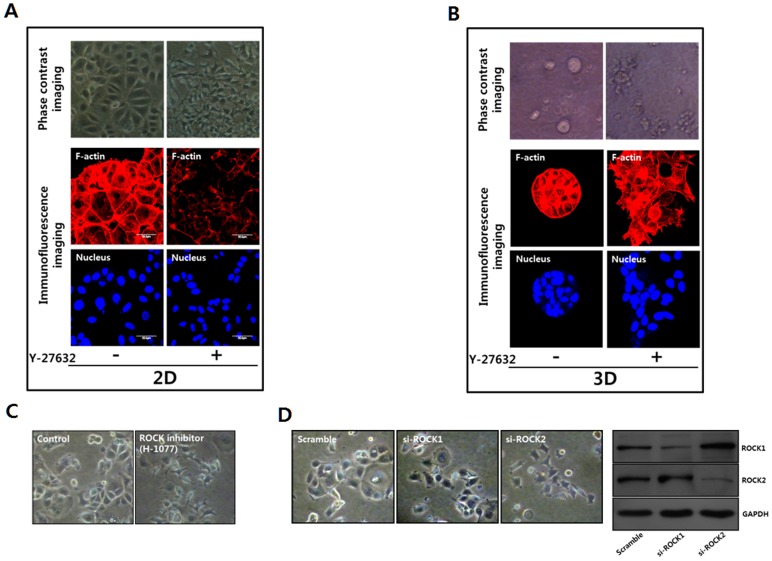
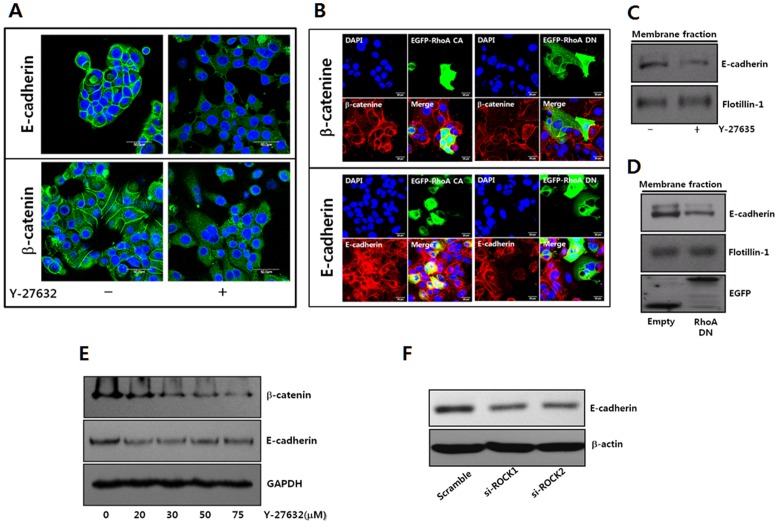
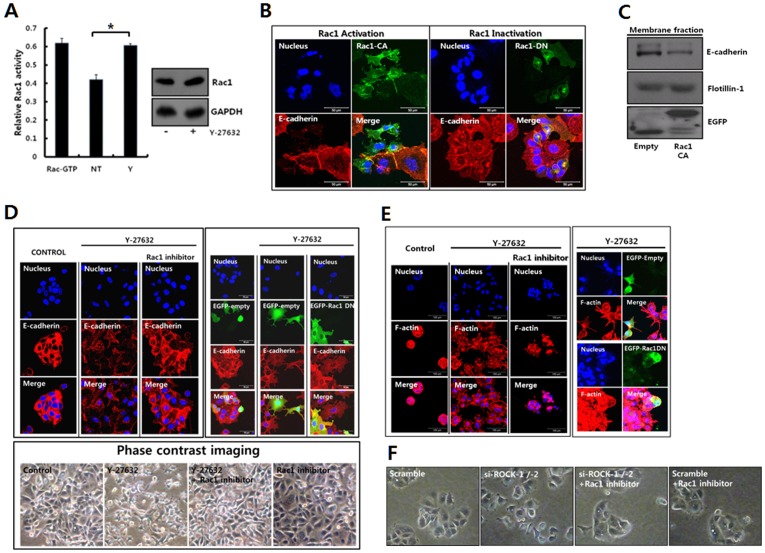
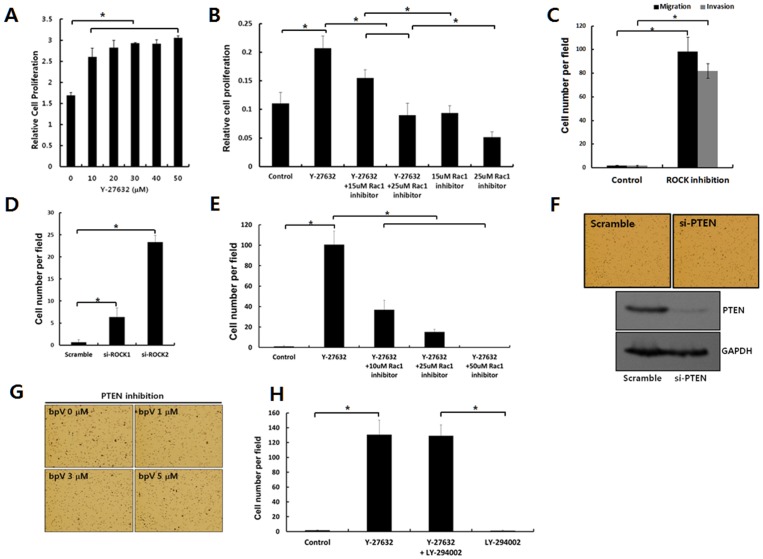
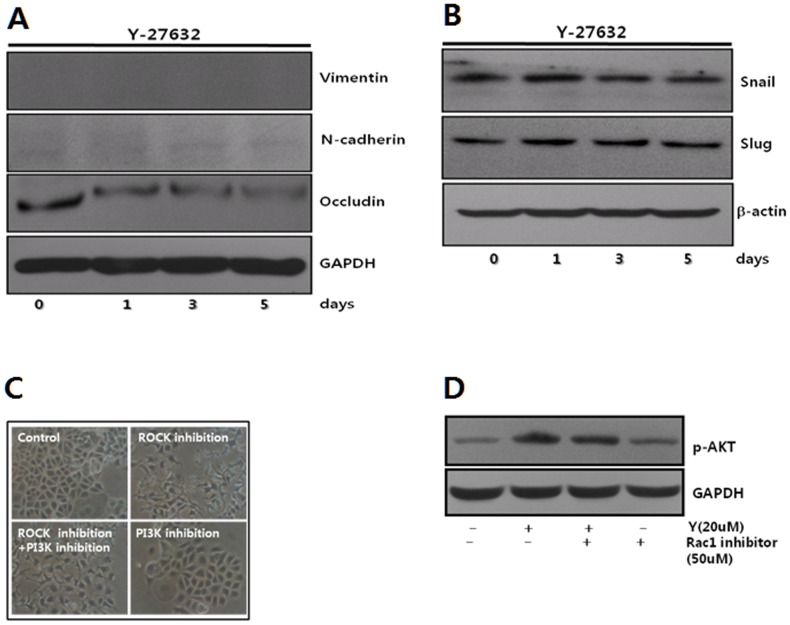
Dormant carcinoma cancer cells showing epithelial characteristics can be activated to dissipate into the surrounding tissue or organs through epithelial-mesenchymal transition (EMT). However, the molecular details underlying the activation of dormant cancer cells have been less explored. In this study, we examined the molecular pathway to activate dormant breast cancer cells. Rho-associated kinase (ROCK) inhibition disrupted cell junction, promoted cell proliferation and migration / invasion in both two-dimensional and three-dimensional substrates. The disintegration of cell junction upon ROCK inhibition, coupled with the loss of E-cadherin and b-catenin from the cell membrane, was associated with the activation of Rac1 upon ROCK inhibition. Migration / invasion also increased upon ROCK inhibition. However, the activation of MCF-7 cells upon ROCK inhibition was not associated with the up-regulation of typical EMT markers, such as snail and slug. Based on these results, we suggest the potential risk for dormant cancer cells to dissipate through non-typical EMT when ROCK activity is down-regulated.


Conflict of interest statement

Competing Interests: The authors have declared that no competing interests exist.

Figures

Figure 1
Figure 1. Cell activation upon ROCK inhibition is evident in low-active MCF-7 cells, not in highly active MDA-MB-231 cells.
A. MCF-7 Cells growing in an epithelial fashion were cultured for three days, whereas MDA-MB-231 cells growing in a mesenchymal fashion were cultured for three days. B. MCF-7 cells and MDA-MB-231 cells were cultured on tissue culture plates for four days with or without Y-27632 (20 µM). Relative cell proliferation rates were determined by the cell number assayed using CCK-8 kit. The data are expressed as the mean ± SD. n = 3 culture dishes. The p-value was less than 0.05 for comparisons between control (Control) and treatment groups (Y-27632) in MCF-7 cells. *, p<0.05. C. The cells seeded on the Transwell chambers for the migration assay were incubated for 24 hrs in the absence or presence of Y-27632 (20 µM). The cells migrated into the lower chamber were manually counted after staining cells with hematoxylin. The data are expressed as the mean ± SD. n = 3 culture dishes. The p-value was less than 0.05 for comparisons between control (Control) and treatment groups (Y-27632). *, p<0.05.
Figure 2
Figure 2. ROCK inhibition induces the scattering of MCF-7 cells in both 2D and 3D cultures.
A. MCF-7 cells were seeded on tissue culture plates for culturing on two-dimensional surfaces (2D). Subsequently, the cells were cultured for 24 hrs in the absence or presence of Y-27632 (20 µM) to inhibit ROCK activity. The cells were plated in the absence of Y-27632 for 12 hours before treating cells with Y-27632 to inhibit ROCK activity. B. MCF-7 cells were cultured on a three-dimensional Matrigel matrix (3D) for 3 days. Subsequently, the cells were cultured for 3 or 4 days in the absence or presence of Y-27632 (20 µM) to inhibit ROCK activity (ROCK inhibition). The cells were observed through phase contrast microscopy or confocal laser microscopy after staining the fixed cells with rhodamine-phalloidin or DAPI to examine actin filaments (red) or nuclei (blue), respectively. C. The cells were cultured for 24 hrs in the absence or presence of H-1700 (30 µM) to inhibit ROCK activity and observed using phase contrast microscopy. D. MCF-7 cell morphology after transfection with control si-RNA (scramble), si-RNA targeting ROCK1 (si-ROCK1) or ROCK2 (si-ROCK2) was observed using phase contrast microscopy. The cells were incubated for 24 hrs after transfecting cells with control si-RNA (scramble), si-RNA targeting ROCK1 (si-ROCK1) or ROCK2 (si–ROCK2). Expression levels of ROCK1 and ROCK2 were measured using immunoblotting.
Figure 3
Figure 3. RhoA and ROCK activities regulate E-cadherin and b-catenin in MCF-7 cells.
A. The localized patterns of E-cadherin and b-catenin were examined using specific antibodies through confocal laser microscopy. MCF-7 cells were cultured for 24 hrs in the absence or presence of Y-27632 (20 µM) to inhibit ROCK activity. B. The activity of RhoA, a major upstream regulating molecule of ROCK, was regulated to examine the role of RhoA-ROCK in regulating the membrane localization of E-cadherin and b-catenin after transfecting MCF-7 cells with constitutively active RhoA (EGFP-RhoA-Q63L, EGFP-RhoA CA) or dominant negative RhoA (EGFP-RhoA-T19N, EGFP-RhoA DN). E-cadherin and b-catenin were analyzed after staining the fixed cells with specific antibodies under confocal laser microscopy. The cells were also stained with DAPI to localize the nuclei. C. Membrane fraction level of E-cadherin was analyzed through immunoblotting using specific antibodies after treating MCF-7 cells with Y-27632 (20 µM) to inhibit ROCK activity for 24 hrs. An antibody to flotillin-1 was used to confirm the equal load of the membrane fraction. D. The level of E-cadherin in the membrane fraction was examined through immunoblotting using specific antibodies after transfecting MCF-7 cells with the pCDNA3-EGFP plasmid (Empty) or pCDNA3-EGFP-RhoA-T19N plasmid (RhoA DN) to inhibit RhoA-ROCK. An antibody to flotillin-1 was used to confirm the equal load of the membrane fraction. E. The total expression of E-cadherin or b-catenin was determined after treating MCF-7 cells with the indicated concentration of Y-27632 for 24 hrs through immunoblotting using the specific antibodies. F. Total expression level of E-cadherin was determined after transfecting cells with control si-RNA (scramble), si-RNA targeting ROCK1 (si-ROCK1) or ROCK2 (si–ROCK2) for 72 hrs through immunoblotting.
Figure 4
Figure 4. ROCK inhibition activates Rac1, which leads the disruption of the MCF-7 cell junction.
A. MCF-7 cells were cultured on tissue culture plates for 48 hrs, and Y-27632 (20 µM) was added into the culture medium for 3 hrs. Equal amounts of cell lysates were used for the G-LISA Rac1 activity assay. The data are expressed as the means ± SD. n = 3 dishes. The p-value was less than 0.05 for comparisons between control (NT: no treatment) and treatment groups (Y: 20 µM Y-27632). *, p<0.05. Total Rac1 expression was determined through immunoblotting using a Rac1-specific antibody (right panel). B. MCF-7 Cells were transfected with plasmids for constitutively active Rac1 (EGFP-Rac1-Q61L, Rac1-CA) or dominant negative Rac1 (EGFP-Rac1-T17N, Rac1-DN). Subsequently, the fixed cells were analyzed through immunofluorescence staining using anti-E-cadherin antibody. The nuclei were stained with DAPI (blue). C. The E-cadherin expression in the membrane fraction was examined through immunoblotting using specific antibodies after transfecting MCF-7 cells with pCDNA3-EGFP plasmid or constitutively active Rac1 (EGFP-Rac1-Q61L, Rac1-CA). An antibody to flotillin-1 was used to confirm the equal load of the membrane fraction of the cell lysates. D. MCF-7 cells were seeded onto tissue culture plates. The next day, the cells were pretreated with Rac1 inhibitor (25 µM) for 1 hr, and Y-27632 (20 µM) was added to the indicated cell groups for 3 hrs (upper left panel). MCF-7 cells were transfected with EGFP plasmid or EGFP-Rac1-T17N plasmid (EGFP-Rac1 DN). Subsequently, Y-27632 (20 µM) was added into the indicated cell groups for 5 hrs (upper right panel). The cells were examined using phase contrast microscopy (lower panel) or confocal laser microscopy after immunofluorescence staining using anti-E-cadherin antibody (upper panel). E. MCF-7 cells were cultured in the Matrigel for 3D culture for 3 days. The cells were additionally cultured for 3 days with Y-27632 (20 µM) in the absence or presence of the Rac1 inhibitor (25 µM) (left panel). The cells were transfected with pCDNA3-EGFP plasmid (EGFP-Empty) or pCDNA3-EGFP-Rac1-T17N (EGFP-Rac1-DN) plasmid for 18 hrs prior to incubation in Matrigel. The cells were incubated in the Matrigel for 2 days. The cells were cultured for 2 additional days with Y-27632 (20 µM) or Rac1 inhibitor (25 µM) (right panel). The cells were fixed and analyzed through confocal laser microscopy after fluorescence staining using rhodamine-phalloidin. F. MCF-7 cells after transfection with control si-RNA (scramble) or si-RNAs targeting both ROCK-1 and -2 (si-ROCK1/2) were incubated for 48 hrs in the absence or presence of Rac1 inhibitor (20 µM). Cell morphology was observed using phase contrast microscopy.
Figure 5
Figure 5. ROCK inhibition of MCF-7 cells increases cell migration and invasion through Rac1 activation.
A. MCF-7 cells were cultured with the indicated concentration of Y-27632 for three days. The cell proliferation rate was subsequently measured through CCK-8 assay. The data are expressed as the mean ± SD. n = 3 dishes. The p-value was less than 0.05 for comparisons between un-treated and treatment groups (Y-27632) upon Krusal-Wallis test. *, p<0.05. B. MCF-7 cells were cultured with Y-27632 (20 µM) in the absence or presence of Rac1 inhibitor (15 or 25 µM) for three days. The cell proliferation rate was subsequently measured through CCK-8 assay. The data are expressed as the mean ± SD. n = 3 dishes. The p-value was less than 0.05 for comparisons between any two groups except comparison between the group of Y-27632 with 25 mM Rac1 inhibitor and the group of 15 mM Rac1 inhibitor upon one-way analysis of variance. *, p<0.05. C. The cells seeded on the Transwell chambers for the migration assay were incubated for 30 hrs in the absence or presence of Y-27632 (20 µM) to inhibit ROCK activity (upper panel). The cells seeded on the Transwell chambers covered with Matrigel for the invasion assay were cultured for 30 hrs in the absence or presence of Y-27632 (20 µM) to inhibit ROCK activity. The cells migrated into the lower chamber were manually counted after staining cells with hematoxylin. The data are expressed as the mean ± SD. n = 3 chambers. *, P<0.05 compared between groups treated with or without Y-27632. D. The cells transfected with control si-RNA (scramble), si-RNA targeting ROCK1 (si-ROCK1) or ROCK2 (si-ROCK2) were seeded on the Transwell chambers for migration assay and incubated for 48 hrs. The cells migrated onto the lower chamber were manually counted after staining cells with hematoxylin. The data are expressed as the mean ± SD. The p-value was less than 0.05 for comparisons between scramble group and transfected groups. *, p<0.05. E. The cells seeded on the Transwell chambers for migration assay were incubated with Y-27632 (20 µM) and the indicated concentration (10, 25 50 mM) of Rac1 inhibitor for 18 hrs. The cells migrated into the lower chamber were stained with hematoxylin. The cells migrated into the lower chamber were manually counted after staining cells with hematoxylin. The data are expressed as the mean ± SD. n = 3. The p-value was less than 0.05 for comparisons between Y-27632 group without Rac1 inhibition and any Y-27632 group with Rac1 inhibition. *, p<0.05. F. Cells transfected with control siRNA (scramble) or siRNA targeting PTEN (si-PTEN) were incubated for 2 days. Subsequently, the cells were replated into the Transwell chambers for migration assay. The cells migrated into the lower chamber for 24 hrs were stained with hematoxylin (upper panel). PTEN expression was analyzed through immunoblotting using specific antibodies against PTEN. G. The cells seeded in Transwell chambers for the migration assay were incubated with the indicated concentration of bpV (PTEN inhibitor; 1, 3, 5 µM) for 24 hrs. Cells migrated into the lower chamber were stained with hematoxylin. H. The cells were seeded in the Transwell chambers for the migration assay and incubated with ROCK inhibitors (Y-27632; 20 µM) and/or PI3-K inhibitors (LY-294002; 10 µM) for 24 hrs. The cells migrated into the lower chamber were manually counted after staining cells with hematoxylin. The data are expressed as the mean ± SD. n = 3. There was no statistical significance between ROCK inhibition groups (Y-27632) with / without PI3K inhibition (LY-294002).
Figure 6
Figure 6. The activation of MCF-7 cells induced by ROCK inhibition follows non-typical EMT.
A and B. Cells were cultured with Y-27632 (20 µM) for the indicated times. The cell lysates were immunoblotted to assess the expression levels of typical EMT marker proteins. C. The cells were treated with Y-27632 (20 µM) to ROCK activity and/or LY-294002 (10 µM) to inhibit PI3-K for 5 hrs. The morphology of the cells was observed through phase contrast microscopy. D. The cells were cultured for 24 hrs and treated with Y-27632 (20 µM) to inhibit ROCK in the presence or absence of Rac1 inhibitor (50 µM) for 3 hrs. Subsequently, the cell lysate from each group was immunoblotted to assess the phosphorylation levels of Akt using the anti-p-Akt antibody.
Figure 7
Figure 7. Adhesion strength has influence on ROCK activity and various cell activities in a dose dependent manner.
A. To compare the relative levels of ROCK activation, depending on the amount of precoated FN, P-MLC expression levels were assessed through immunoblotting analysis using an anti-P-MLC antibody. B. The cells were cultured for three days on the hydrophobic culture dishes precoated with indicated amounts of fibronectin. Cell number was analyzed using CCK-8 kit. The data are expressed as the means ± SD. n = 3 dishes. The p-value was less than 0.05 for comparisons between any two groups. *, p<0.05. C. The cells seeded on the Transwell chambers precoated with the indicated amounts of fibronectin (FN) for the migration assay were incubated for 48 hrs. The cells migrated into the lower chamber were manually counted after staining cells with hematoxylin. The data are expressed as the mean ± SD. n = 3. The p-value was less than 0.05 for comparisons between any two groups. *, p<0.05. D. MCF-7 Cells were cultured for two days on hydrophobic culture dishes precoated with the indicated amounts of fibronectin (FN). The substrates were blocked with albumin (5% v/v) after coating with fibronectin. The localized patterns of F-actin and E-cadherin were examined using FITC-phalloidin and Cy3-E-cadherin through confocal laser microscopy. E. MCF-7 Cells were cultured for two days on hydrophobic culture dishes precoated with the indicated amounts of fibronectin (FN). The substrates were blocked with albumin (5% v/v) after coating with fibronectin. Cell morphology was examined using phase-contrast microscopy.

Similar articles

Cited by

References

    1. Trimboli AJ, Fukino K, de Bruin A, Wei G, Shen L, et al. (2008) Direct evidence for epithelial-mesenchymal transitions in breast cancer. Cancer Res 68: 937–945. - PubMed
    1. Dave B, Mittal V, Tan NM, Chang JC (2012) Epithelial-mesenchymal transition, cancer stem cells and treatment resistance. Breast Cancer Res 14: 202. - PMC - PubMed
    1. Aguirre-Ghiso JA (2007) Models, mechanisms and clinical evidence for cancer dormancy. Nat Rev Cancer 7: 834–846. - PMC - PubMed
    1. Paez D, Labonte MJ, Bohanes P, Zhang W, Benhanim L, et al. (2012) Cancer Dormancy: A Model of Early Dissemination and Late Cancer Recurrence. Clin Cancer Res 18: 645–653. - PubMed
    1. Brackstone M, Townson JL, Chambers AF (2007) Tumour dormancy in breast cancer: an update. Breast Cancer Res 9: 208. - PMC - PubMed

Publication types