. 2014 Feb 11;9(2):e88889.
doi: 10.1371/journal.pone.0088889. eCollection 2014.

Functionally enigmatic genes: a case study of the brain ignorome

Affiliations

Functionally enigmatic genes: a case study of the brain ignorome

Ashutosh K Pandey et al. PLoS One. .

Abstract

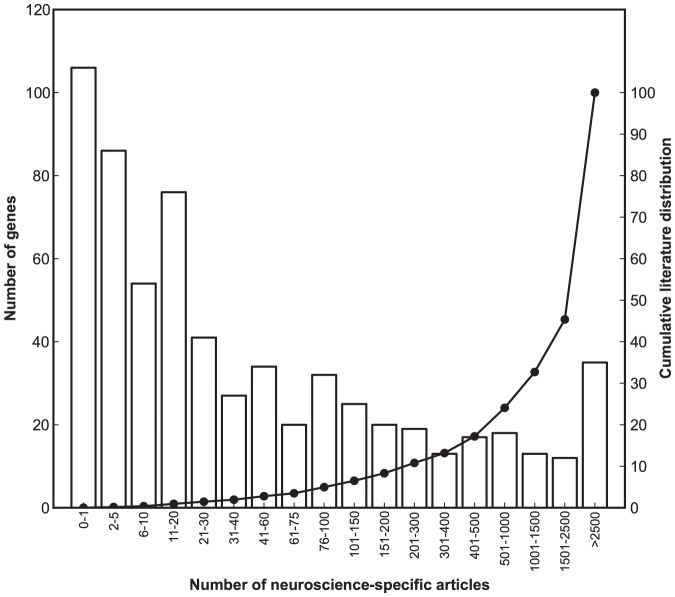
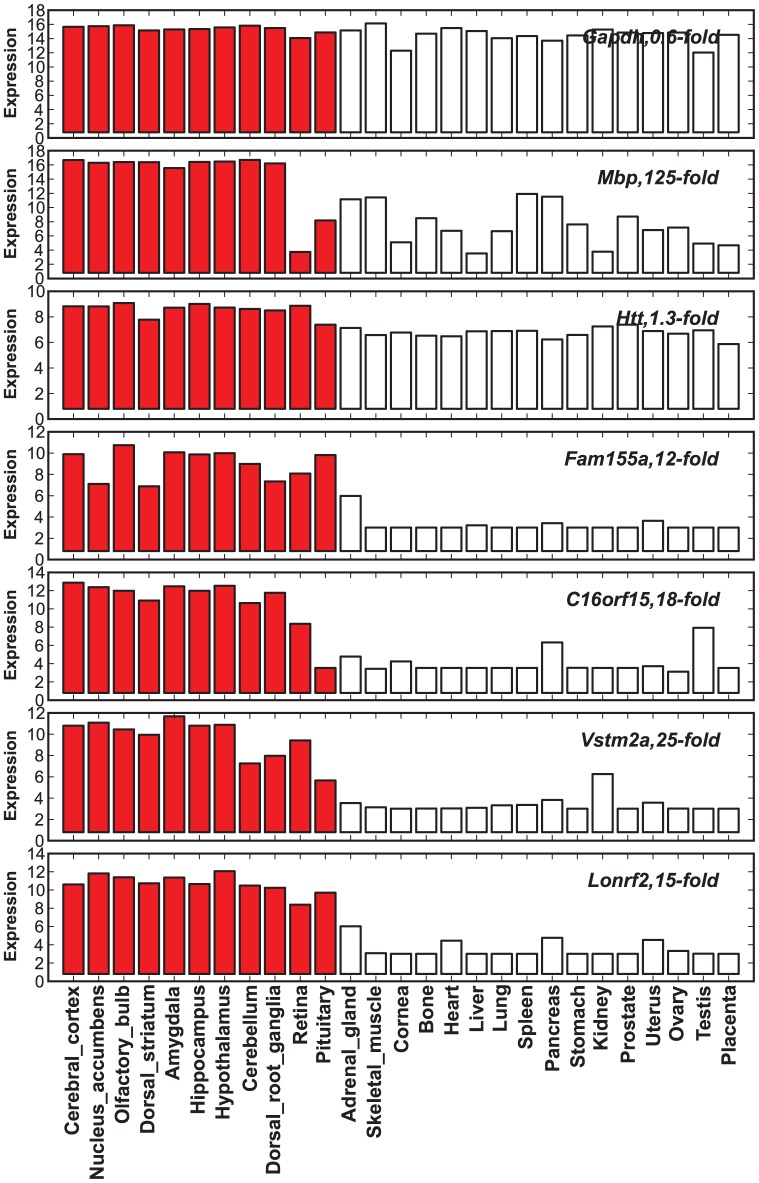
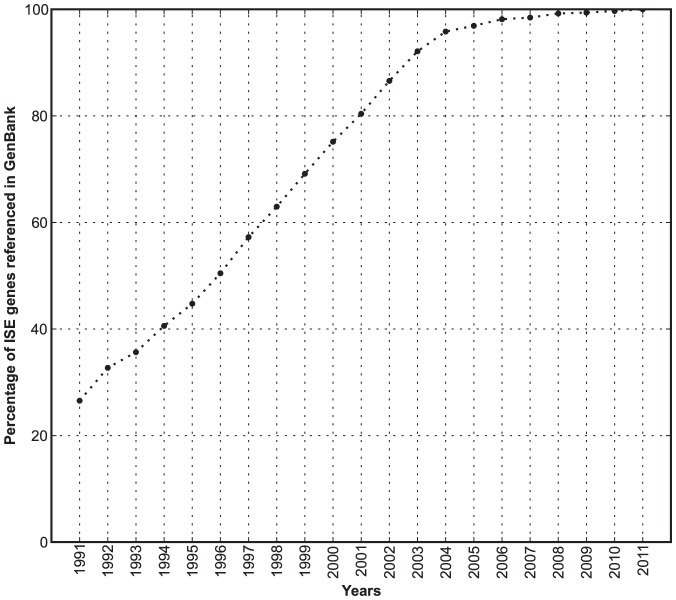
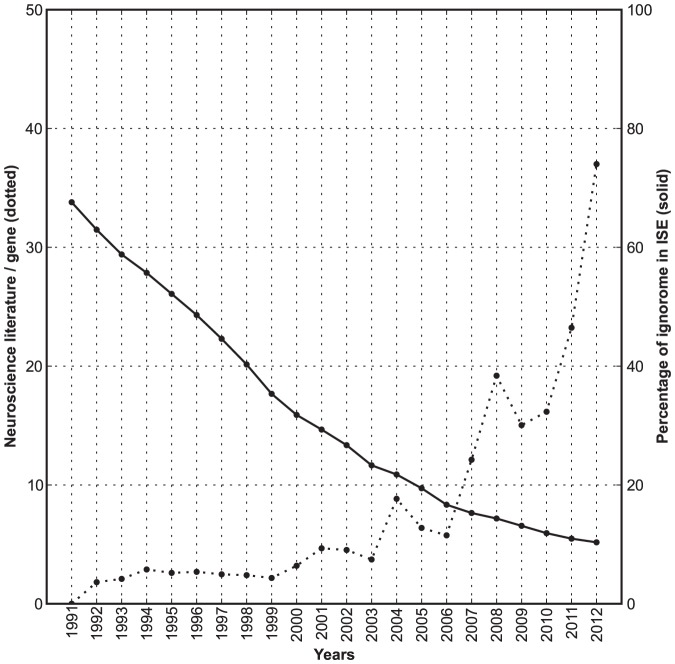
What proportion of genes with intense and selective expression in specific tissues, cells, or systems are still almost completely uncharacterized with respect to biological function? In what ways do these functionally enigmatic genes differ from well-studied genes? To address these two questions, we devised a computational approach that defines so-called ignoromes. As proof of principle, we extracted and analyzed a large subset of genes with intense and selective expression in brain. We find that publications associated with this set are highly skewed--the top 5% of genes absorb 70% of the relevant literature. In contrast, approximately 20% of genes have essentially no neuroscience literature. Analysis of the ignorome over the past decade demonstrates that it is stubbornly persistent, and the rapid expansion of the neuroscience literature has not had the expected effect on numbers of these genes. Surprisingly, ignorome genes do not differ from well-studied genes in terms of connectivity in coexpression networks. Nor do they differ with respect to numbers of orthologs, paralogs, or protein domains. The major distinguishing characteristic between these sets of genes is date of discovery, early discovery being associated with greater research momentum--a genomic bandwagon effect. Finally we ask to what extent massive genomic, imaging, and phenotype data sets can be used to provide high-throughput functional annotation for an entire ignorome. In a majority of cases we have been able to extract and add significant information for these neglected genes. In several cases--ELMOD1, TMEM88B, and DZANK1--we have exploited sequence polymorphisms, large phenome data sets, and reverse genetic methods to evaluate the function of ignorome genes.


Conflict of interest statement

Competing Interests: Co-author Dr. Ramin Homayouni is a PLOS ONE Editorial Board member. The authors confirm that this does not alter their adherence to all the PLOS ONE policies on sharing data and materials.

Figures

Figure 1
Figure 1. Literature density of 648 genes with intense and selective expression in the brain.
The x-axis represents the number of neuroscience-related references in PubMed as of February 2013. The left y-axis represents the number of genes. The right y-axis represents the cumulative literature distribution for ISE genes. A subset of ∼30 genes to the far right (last two bars) absorb two-thirds of the total neuroscience literature. In contrast, ∼200 genes to the far left (first two bars) absorb only 0.1% of the literature.
Figure 2
Figure 2. Expression comparison between a few well-studied and ignorome genes in multiple tissues and organs.
The x-axis represents multiple tissues and organs including several brain regions represented by red colored bars. y-axis represents the log2 transformed expression values downloaded from BioGPS (www.biogps.org). We included interesting examples including (1) GAPDH, a house keeping gene, (2) MBP, an extensively studied gene with high brain selectivity, (3) HTT (HD), an important neuroscience gene with low brain selectivity, and ignorome genes including FAM155A, C16orf15, VSTM2A, and LONRF2 with highly selective expression in brain.
Figure 3
Figure 3. Expression of ignorome transcripts in the C57BL/6J brain.
Pairs of low (scale on the lower left represents 1500 microns) and high (scale on the lower right represents 750 microns) resolution images of C57BL/6J brain sagittal sections (labeled using in situ probes) for six ignorome gene members taken from the Allen Brain Atlas (http://www.brain-map.org/). A) and B) are low and high resolution images showing in situ expression of ZCCHC18 in sagittal sections. C) and D) show expression of FRRS1L. E) and F) show expression of C8orf46 and G) and H) show expression of FAM123C, I) and J) show expression of KIAA2139, and K) and L) show expression of CMTM5.
Figure 4
Figure 4. Year of discovery of genes.
The x-axis represents the timeline. The line represents the perecentage of ISE genes whose mRNA or protein have been referenced into GenBank.
Figure 5
Figure 5. Shrinkage of the ignorome.
The x-axis represents the timeline. The solid line represents the percentage of ignorome genes in the ISE brain set. The dotted line represents the number of neuroscience specific literature (in thousands).

References

    1. Hoffmann R, Valencia A (2003) Life cycles of successful genes. Trends Genet 19: 79–81. - PubMed
    1. Su AI, Hogenesch JB (2007) Power-law-like distributions in biomedical publications and research funding. Genome Biol 8: 404. - PMC - PubMed
    1. Pfeiffer T, Hoffmann R (2007) Temporal patterns of genes in scientific publications. Proc Natl Acad Sci U S A 104: 12052–12056. - PMC - PubMed
    1. Chesler EJ, Williams RW (2004) Brain gene expression: genomics and genetics. Int Rev Neurobiol 60: 59–95. - PubMed
    1. Mozhui K, Ciobanu DC, Schikorski T, Wang X, Lu L, et al. (2008) Dissection of a QTL hotspot on mouse distal chromosome 1 that modulates neurobehavioral phenotypes and gene expression. PLoS Genet 4: e1000260. - PMC - PubMed

Publication types