

Development and validation of a high density SNP genotyping array for Atlantic salmon (Salmo salar)
- PMID: 24524230
- PMCID: PMC3923896
- DOI: 10.1186/1471-2164-15-90
Development and validation of a high density SNP genotyping array for Atlantic salmon (Salmo salar)
Abstract
Background: Dense single nucleotide polymorphism (SNP) genotyping arrays provide extensive information on polymorphic variation across the genome of species of interest. Such information can be used in studies of the genetic architecture of quantitative traits and to improve the accuracy of selection in breeding programs. In Atlantic salmon (Salmo salar), these goals are currently hampered by the lack of a high-density SNP genotyping platform. Therefore, the aim of the study was to develop and test a dense Atlantic salmon SNP array.
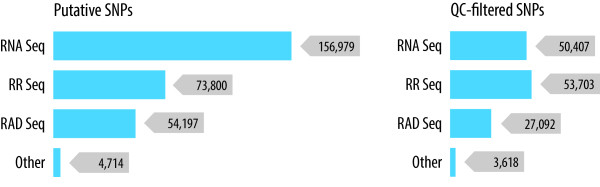
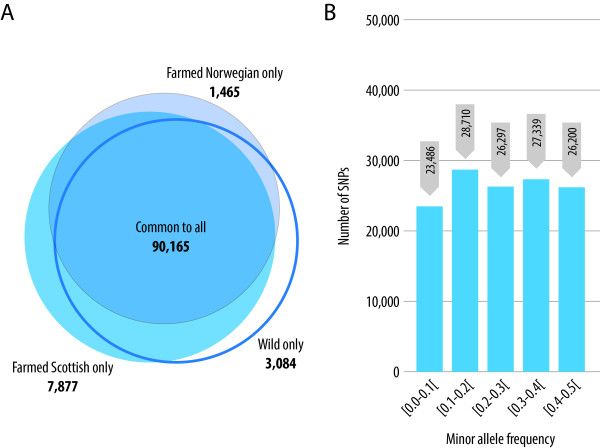
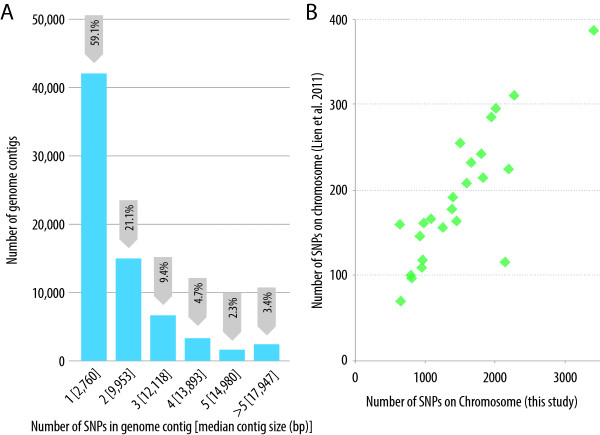
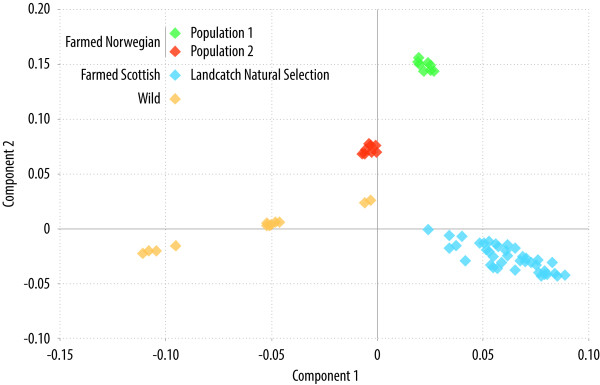
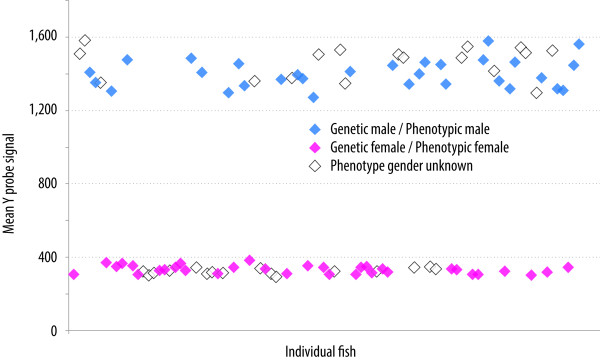
Results: SNP discovery was performed using extensive deep sequencing of Reduced Representation (RR-Seq), Restriction site-Associated DNA (RAD-Seq) and mRNA (RNA-Seq) libraries derived from farmed and wild Atlantic salmon samples (n = 283) resulting in the discovery of > 400 K putative SNPs. An Affymetrix Axiom® myDesign Custom Array was created and tested on samples of animals of wild and farmed origin (n = 96) revealing a total of 132,033 polymorphic SNPs with high call rate, good cluster separation on the array and stable Mendelian inheritance in our sample. At least 38% of these SNPs are from transcribed genomic regions and therefore more likely to include functional variants. Linkage analysis utilising the lack of male recombination in salmonids allowed the mapping of 40,214 SNPs distributed across all 29 pairs of chromosomes, highlighting the extensive genome-wide coverage of the SNPs. An identity-by-state clustering analysis revealed that the array can clearly distinguish between fish of different origins, within and between farmed and wild populations. Finally, Y-chromosome-specific probes included on the array provide an accurate molecular genetic test for sex.
Conclusions: This manuscript describes the first high-density SNP genotyping array for Atlantic salmon. This array will be publicly available and is likely to be used as a platform for high-resolution genetics research into traits of evolutionary and economic importance in salmonids and in aquaculture breeding programs via genomic selection.
Figures
References
-
- FAO. The State of World Fisheries and Aquaculture. 2012. [ http://www.fao.org/docrep/016/i2727e/i2727e.pdf]
-
- Lien S, Gidskehaug L, Moen T, Hayes BJ, Berg PR, Davidson WS, Omholt SW, Kent MP. A dense SNP-based linkage map for Atlantic salmon (Salmo salar) reveals extended chromosome homeologies and striking differences in sex-specific recombination patterns. BMC Genomics. 2011;15:615. doi: 10.1186/1471-2164-12-615. - DOI - PMC - PubMed
-
- Gjoen HM, Bentsen HB. Past, present, and future of genetic improvement in salmon aquaculture. Ices J Mar Sci. 1997;15:1009–1014.
-
- Gjedrem T, Robinson N, Rye M. The importance of selective breeding in aquaculture to meet future demands for animal protein: a review. Aquaculture. 2012;15:117–129.
Publication types
MeSH terms
Grants and funding
- BBS/E/D/20211550/BB_/Biotechnology and Biological Sciences Research Council/United Kingdom
- BB/F001959/1/BB_/Biotechnology and Biological Sciences Research Council/United Kingdom
- BB/F002750/1/BB_/Biotechnology and Biological Sciences Research Council/United Kingdom
- BB/H022007/1/BB_/Biotechnology and Biological Sciences Research Council/United Kingdom
LinkOut - more resources
Full Text Sources
Other Literature Sources
Miscellaneous
