. 2014 Feb 13:11:14.
doi: 10.1186/1743-0003-11-14.

Walking reduces sensorimotor network connectivity compared to standing

Affiliations

Walking reduces sensorimotor network connectivity compared to standing

Troy M Lau et al. J Neuroeng Rehabil. .

Abstract

Background: Considerable effort has been devoted to mapping the functional and effective connectivity of the human brain, but these efforts have largely been limited to tasks involving stationary subjects. Recent advances with high-density electroencephalography (EEG) and Independent Components Analysis (ICA) have enabled study of electrocortical activity during human locomotion. The goal of this work was to measure the effective connectivity of cortical activity during human standing and walking.

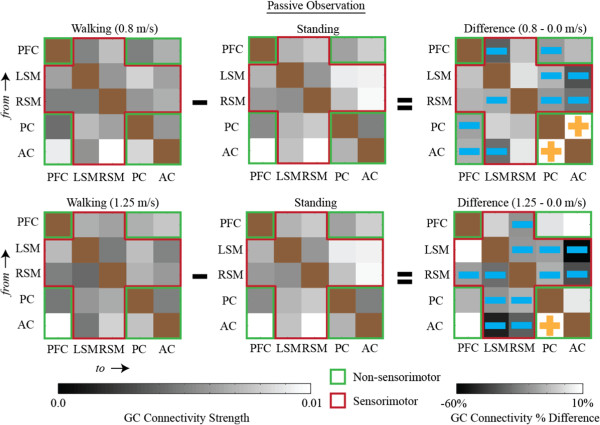
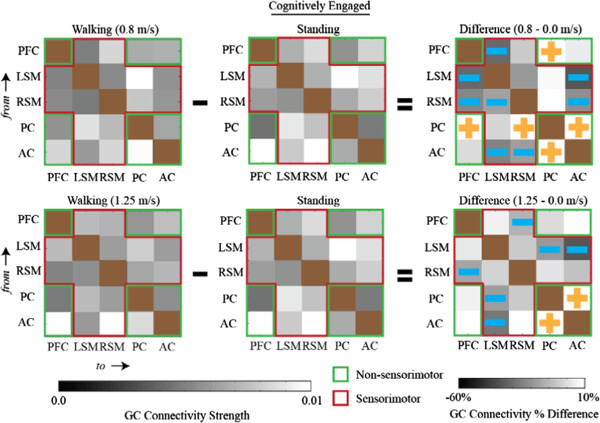
Methods: We recorded 248-channels of EEG as eight young healthy subjects stood and walked on a treadmill both while performing a visual oddball discrimination task and not performing the task. ICA parsed underlying electrocortical, electromyographic, and artifact sources from the EEG signals. Inverse source modeling methods and clustering algorithms localized posterior, anterior, prefrontal, left sensorimotor, and right sensorimotor clusters of electrocortical sources across subjects. We applied a directional measure of connectivity, conditional Granger causality, to determine the effective connectivity between electrocortical sources.

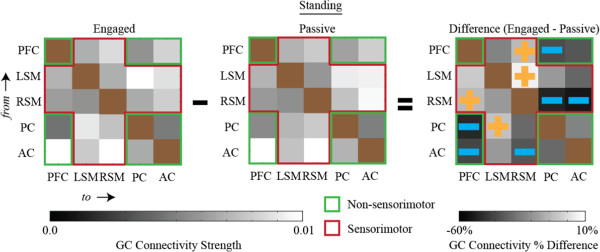
Results: Connections involving sensorimotor clusters were weaker for walking than standing regardless of whether the subject was performing the simultaneous cognitive task or not. This finding supports the idea that cortical involvement during standing is greater than during walking, possibly because spinal neural networks play a greater role in locomotor control than standing control. Conversely, effective connectivity involving non-sensorimotor areas was stronger for walking than standing when subjects were engaged in the simultaneous cognitive task.

Conclusions: Our results suggest that standing results in greater functional connectivity between sensorimotor cortical areas than walking does. Greater cognitive attention to standing posture than to walking control could be one interpretation of that finding. These techniques could be applied to clinical populations during gait to better investigate neural substrates involved in mobility disorders.


Figures

Figure 1
Figure 1
Granger causality network connections for all subjects while walking at 1.25 m/s while not engaged in the visual oddball task. Nodes shown are from statistically significant connections aggregated across all subjects. Nodes were in slightly different locations for each subject, some subjects had multiple nodes/region some had none. The thicker the line, the stronger the Granger Causality value. Nodes are clustered and color coated per their anatomical regions. Significant connections were determined by the F-statistic.
Figure 2
Figure 2
Grand average percentage changes in network connectivity between conditions. Connectivity during walking minus connectivity during standing is shown for sensorimotor (blue) and non-sensorimotor (red) network nodes when subjects were not engaged in the cognitive task (panel a) and when subjects were engaged in the cognitive task (panel b). Walking significant decreases sensorimotor network connectivity compared to standing and, when subjects are actively engaged in the cognitive task (panel b), walking significantly increase non-sensorimotor network connectivity. Panel c shows connectivity during active standing (actively engaged in the cognitive task) minus connectivity during passive (not engaged in the cognitive task). Passive standing elicited greater non-sensorimotor network connectivity than active standing, demonstrating the expected non-sensorimotor default mode network. * = p < 0.04.
Figure 3
Figure 3
Connectivity diagrams when subjects were not engaged in the cognitive task for (first column) walking, (second column) standing, and (third column) the connectivity strength differences between walking and standing (i.e., walking minus standing). Walking speeds were (first row) 0.8 m/s and (second row) 1.25 m/s. The sensorimotor network nodes (left sensorimotor (LSM) and right sensorimotor (RSM)) are outlined in red and the non-sensorimotor network nodes (prefrontal cluster (PFC), posterior parietal cortex (PC), and anterior cingulate (AC)) are outlined in green. Statistically significant increases or decreases in connectivity strength that are more than two standard errors from zero are identified by gold plus signs and blue minus signs, respectively. All significant changes in connectivity strength between walking and standing within the sensorimotor network, at both speeds, were negative (i.e., functional connectivity involving sensorimotor areas was weaker during walking than during standing). The diagonal blocks are brown because no connectivity strengths were calculated for connections within the same brain area. GC Connectivity Strength can range from 0–1.
Figure 4
Figure 4
Connectivity diagrams when subjects were actively engaged in the cognitive task for (first column) walking, (second column) standing, and (third column) the connectivity strength differences between walking and standing (i.e., walking minus standing). Walking speeds were (first row) 0.8 m/s and (second row) 1.25 m/s. The sensorimotor network nodes (left sensorimotor (LSM) and right sensorimotor (RSM)) are outlined in red and the non-sensorimotor network nodes (prefrontal (PF), posterior parietal cortex (PC), and anterior cingulate (AC)) are outlined in green. Statistically significant increases or decreases in connectivity strength that are more than two standard errors from zero are identified by gold plus signs and blue minus signs, respectively. Nearly all significant changes in connectivity strength between walking and standing within the sensorimotor network, at both speeds, were negative (i.e., functional connectivity involving sensorimotor areas was weaker during walking than during standing). All significant changes in connectivity strength within the non-sensorimotor network, at both speeds, were positive (i.e., when actively engaged in a cognitive task, walking enhances connectivity among non-sensorimotor network nodes). The diagonal blocks are brown because no connectivity strengths were calculated for connections within the same brain area.
Figure 5
Figure 5
Connectivity diagrams during standing (first column) when subjects were actively engaged in the cognitive task, (second column) when not actively engaged in the cognitive task, and (third column) the connectivity strength differences between active engagement and passive observation (i.e., cognitively active minus cognitively passive). The sensorimotor network nodes (left sensorimotor (LSM) and right sensorimotor (RSM)) are outlined in red and the non-sensorimotor network nodes (prefrontal cortex(PFC), posterior parietal cortex (PC), and anterior cingulate (AC)) are outlined in green. Statistically significant increases or decreases in connectivity strength that are more than two standard errors from zero are identified by gold plus signs and blue minus signs, respectively. All significant changes in connectivity strength within the non-sensorimotor network were negative (i.e., the cognitive network was suppressed when subjects actively engaged in the cognitive task). The diagonal blocks are brown because no connectivity strengths were calculated for connections within the same brain area.

References

    1. Friston KJ, Holmes AP, Worsley KJ, Poline JP, Frith CD, Frackowiak RSJ. Statistical parametric maps in functional imaging: a general linear approach. Hum Brain Mapp. 1994;2:189–210. doi: 10.1002/hbm.460020402. - DOI
    1. Eguiluz VM, Chialvo DR, Cecchi GA, Baliki M, Apkarian AV. Scale-free brain functional networks. Phys Rev Lett. 2005;94:018102. - PubMed
    1. Greicius MD, Krasnow B, Reiss AL, Menon V. Functional connectivity in the resting brain: a network analysis of the default mode hypothesis. Proc Natl Acad Sci U S A. 2003;100:253–258. doi: 10.1073/pnas.0135058100. - DOI - PMC - PubMed
    1. Meunier D, Achard S, Morcom A, Bullmore E. Age-related changes in modular organization of human brain functional networks. Neuroimage. 2009;44:715–723. doi: 10.1016/j.neuroimage.2008.09.062. - DOI - PubMed
    1. Micheloyannis S, Pachou E, Stam CJ, Vourkas M, Erimaki S, Tsirka V. Using graph theoretical analysis of multi channel EEG to evaluate the neural efficiency hypothesis. Neurosci Lett. 2006;402:273–277. doi: 10.1016/j.neulet.2006.04.006. - DOI - PubMed

Publication types

LinkOut - more resources