Review
. 2014 Jan;10(1):2-42.
doi: 10.2174/1573399810666140214093600.

Assessment of pancreatic β-cell function: review of methods and clinical applications

Affiliations
Free PMC article
Review

Assessment of pancreatic β-cell function: review of methods and clinical applications

Eugenio Cersosimo et al. Curr Diabetes Rev. 2014 Jan.
Free PMC article

Abstract

Type 2 diabetes mellitus (T2DM) is characterized by a progressive failure of pancreatic β-cell function (BCF) with insulin resistance. Once insulin over-secretion can no longer compensate for the degree of insulin resistance, hyperglycemia becomes clinically significant and deterioration of residual β-cell reserve accelerates. This pathophysiology has important therapeutic implications. Ideally, therapy should address the underlying pathology and should be started early along the spectrum of decreasing glucose tolerance in order to prevent or slow β-cell failure and reverse insulin resistance. The development of an optimal treatment strategy for each patient requires accurate diagnostic tools for evaluating the underlying state of glucose tolerance. This review focuses on the most widely used methods for measuring BCF within the context of insulin resistance and includes examples of their use in prediabetes and T2DM, with an emphasis on the most recent therapeutic options (dipeptidyl peptidase-4 inhibitors and glucagon-like peptide-1 receptor agonists). Methods of BCF measurement include the homeostasis model assessment (HOMA); oral glucose tolerance tests, intravenous glucose tolerance tests (IVGTT), and meal tolerance tests; and the hyperglycemic clamp procedure. To provide a meaningful evaluation of BCF, it is necessary to interpret all observations within the context of insulin resistance. Therefore, this review also discusses methods utilized to quantitate insulin-dependent glucose metabolism, such as the IVGTT and the euglycemic-hyperinsulinemic clamp procedures. In addition, an example is presented of a mathematical modeling approach that can use data from BCF measurements to develop a better understanding of BCF behavior and the overall status of glucose tolerance.


Figures

Fig. (1)
Fig. (1)
Diagrams illustrating the progressive loss of BCF as glucose tolerance worsens. (a) The disposition index (insulin secretion/insulin resistance = ΔI/ΔG ÷ IR) is plotted as a function of the 2-hour plasma glucose concentration (2-h PG) during an OGTT in subjects with a range of glucose intolerance and body weight. If a 2-hour PG <140 mg/dL represents normal glucose tolerance (NGT), subjects in the upper tertile (2-h PG=120-139 mg/dL) have lost two-thirds of their BCF (left arrow). Subjects in the upper tertile of IGT (2-h PG=180-199 mg/dL) have lost 80%-85% of their BCF (right arrow). Thus, by the time the diagnosis of T2DM has been made, >80% of BCF is gone. Note: Leg-end for y-axis should be "ΔI/ΔG ÷ IR." (b) The natural log of the 2-hour plasma glucose concentration (2-h PG) during the OGTT is graphed as a function of the natural log of the disposition index. These two variables are strongly and linearly related (r=0.91; P<0.00001). There are no cut points that distinguish NGT from IGT from T2DM. Rather, glucose intolerance is a continuum, and subjects simply move up and down this curve as a function of the disposition index. SI units glucose conversion: mg/dL*0.05551=mmol/L. From reference [2]. BCF, β-cell function; OGTT, oral glucose tolerance test; T2DM, type 2 diabetes mellitus.
Fig. (2)
Fig. (2)
Homeostasis model assessment predictions for the basal or fasting state in humans. The grid shows the model prediction of the steady-state plasma glucose and insulin concentrations for a series of different β-cell functions (solid lines) and insulin resistance values (dotted line). For any individual, fasting observations of plasma glucose and insulin may be entered on the grid and the estimated β-cell function and insulin resistance obtained. From reference [4].
Fig. (3)
Fig. (3)
Typical plasma kinetics for glucose (a) and insulin (b, c) during an IV glucose tolerance test in subjects with different degrees of glucose intolerance. Insulin is expressed as a percentage of baseline insulin concentration in panel C. IGT, impaired glucose tolerance; IV, intravenous; NGT, normal glucose tolerance; T2DM, type 2 diabetes mellitus. From reference [184].
Fig. (4)
Fig. (4)
Typical plasma kinetics for glucose (a), insulin (b), and glucagon (c) during a 75-g OGTT in subjects with different degrees of glucose intolerance. Note that the typical OGTT observation period is 120 or 180 min; however, this example covers a 300-min period. IGT, impaired glucose; tolerance; NGT, normal glucose tolerance; OGTT, oral glucose tolerance test; T2DM, type 2 diabetes mellitus. From reference [184].
Fig. (5)
Fig. (5)
Representative illustration of a hyperglycemic clamp with 15 mmol/L arginine stimulation at the 260-min time point. (a) Plasma C-peptide concentrations. Filled circles, baseline. Open squares, Week 52. Hatched squares, Week 56. Mean±SEM (b) Ratios to pretreatment for AIRarg, first-phase secretory response, and second-phase secretory response in patients with type 2 diabetes treated with exenatide 10 µg twice daily for 52 weeks, followed by no drug treatment for 4 weeks. Filled columns, baseline. Open columns, Week 52. Hatched columns, Week 56. Geometric mean±SEM. AIRarg, acute plasma insulin response to arginine; SEM, standard error of the mean. From reference [132].
Fig. (6)
Fig. (6)
Schematic representation of the natural progression of T2DM highlighting the need for BCF measurements to devise optimal treatment strategies. Top panel: Shows the initial subclinical elevation of the postprandial glucose followed by overt fasting hyperglycemia. The disease process, however, begins 5-10 years prior to the actual diagnosis. Lower panel: Diabetes starts with an early development of severe insulin resistance, both hepatic and peripheral. This insulin resistance is fully compensated by a proportionate increase in pancreatic β-cell insulin oversecretion. This balance maintains normoglycemia, but already reflects some degree of β-cell dysfunction. By the time insulin resistance reaches a near-maximum, clinically relevant hyperglycemia has manifested. This is coincident with further deterioration of the BCF, characterized by a progressive failure to secrete sufficient insulin to maintain normoglycemia. The pathogenesis of T2DM provides opportunities for therapeutic interventions to slow or prevent the appearance of frank hyperglycemia. The early and accurate diagnosis of the degree of β-cell dysfunction is critical to enable these interventions. Currently, the hyperglycemic clamp procedure with a C-peptide deconvolution analysis, the IVGTT minimal model with calculation of the disposition index, and the insulin secretion indices derived from a MTT represent superior methods of assessing BCF. Applying the HOMA model and/or the standard OGTT, although more convenient and easier to implement, are less sensitive methods for the detection of β-cell dysfunction as the disease progresses. In the later stages of the disease, the determination of plasma insulin, C-peptide, fasting and random plasma glucose levels, which are routine measurements, will indicate advanced β-cell failure. BCF, β-cell function; HOMA, homeostasis model assessment; IVGTT, intravenous glucose tolerance test; MTT, meal tolerance test; OGTT, oral glucose tolerance test; T2DM, type 2 diabetes mellitus. Modified from [185].

References

    1. American Diabetes Association. Standards of medical care-2013. Diabetes Care. 2013;36 (Suppl 1):S11–66. - PMC - PubMed
    1. DeFronzo RA. From the triumvirate to the ominous octet: a new paradigm for the treatment of type 2 diabetes mellitus. Diabetes. 2009;58:773–95. - PMC - PubMed
    1. International Expert Committee. International Expert Committee report on the role of the A1C assay in the diagnosis of diabetes. Diabetes Care. 2009;32:1327–34. - PMC - PubMed
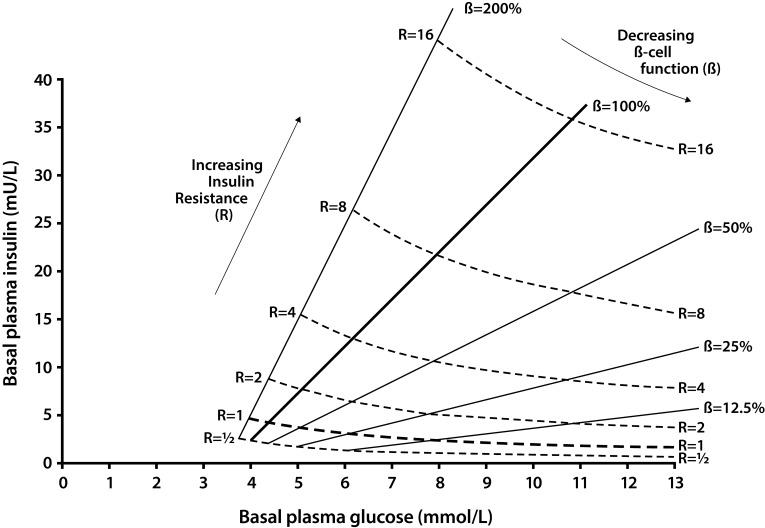
    1. Matthews DR, Hosker JP, Rudenski AS, Naylor BA, Treacher DF, Turner RL. Homeostasis model assessment: insulin resistance and β-cell function from fasting plasma glucose and insulin concentrations in man. Diabetologia. 1985;28:412–9. - PubMed
    1. UK Prospective Diabetes Study Group. UK Prospective Diabetes Study (UKPDS) VIII. Study design, progress and performance. Diabetologia. 1991;34:877–90. - PubMed

Publication types

MeSH terms

LinkOut - more resources