. 2014 Jul 1;23(13):3523-36.
doi: 10.1093/hmg/ddu064. Epub 2014 Feb 12.

The familial Alzheimer's disease APPV717I mutation alters APP processing and Tau expression in iPSC-derived neurons

Affiliations

The familial Alzheimer's disease APPV717I mutation alters APP processing and Tau expression in iPSC-derived neurons

Christina R Muratore et al. Hum Mol Genet. .

Abstract

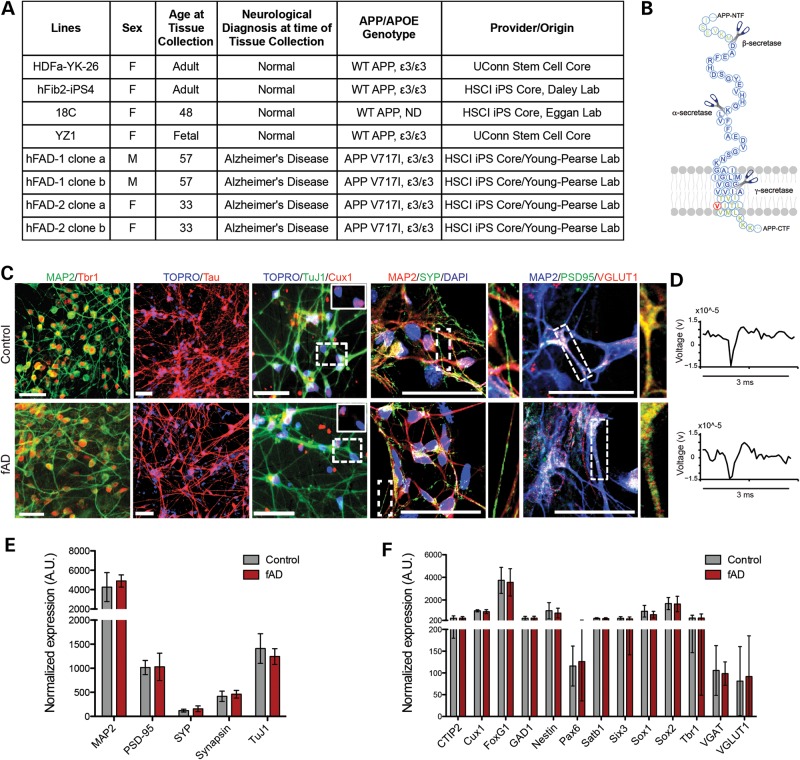
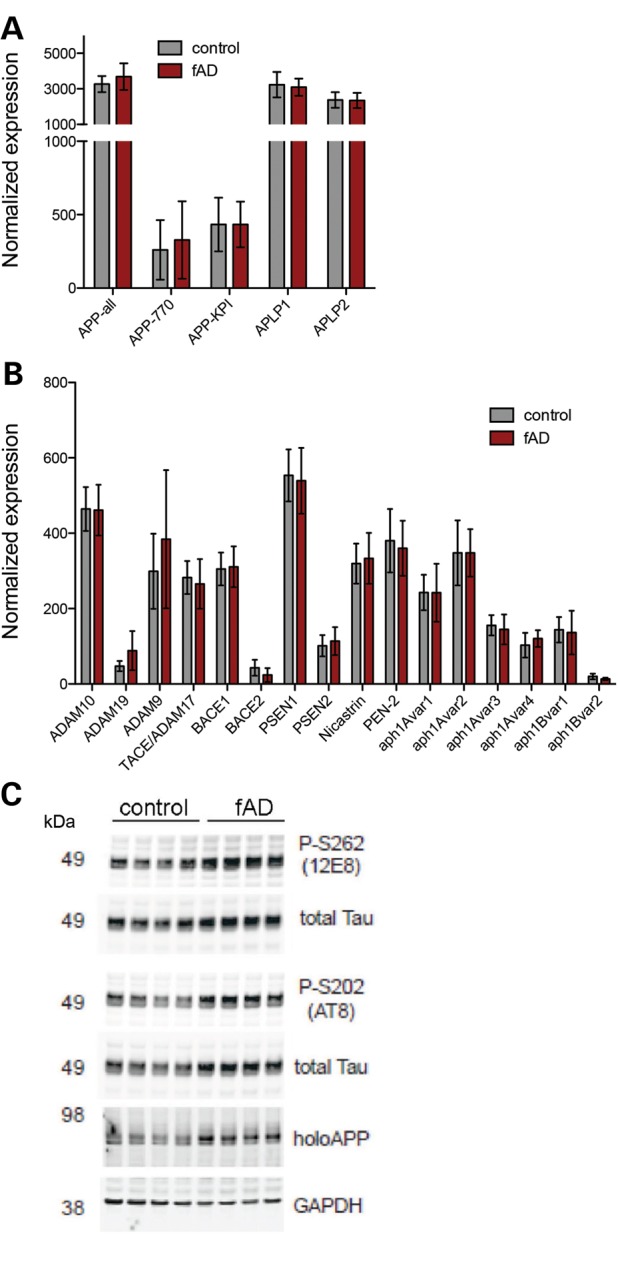
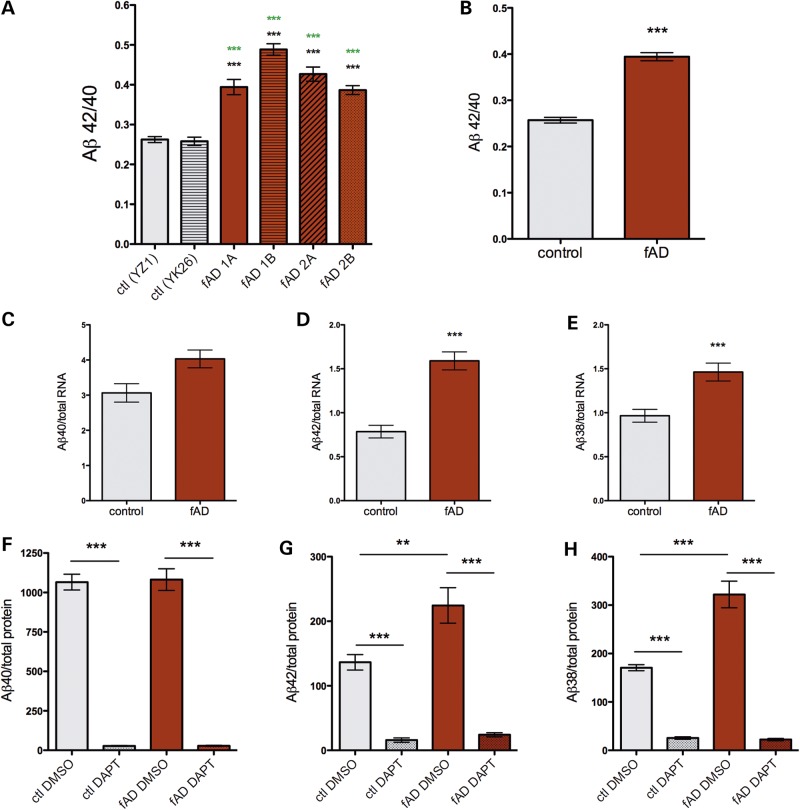
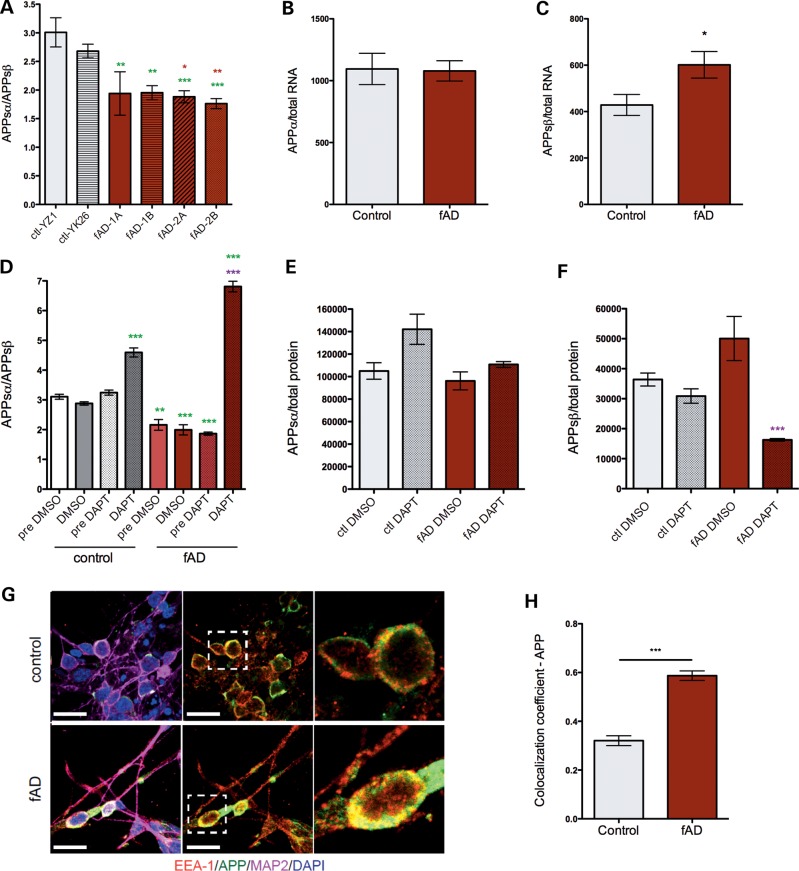
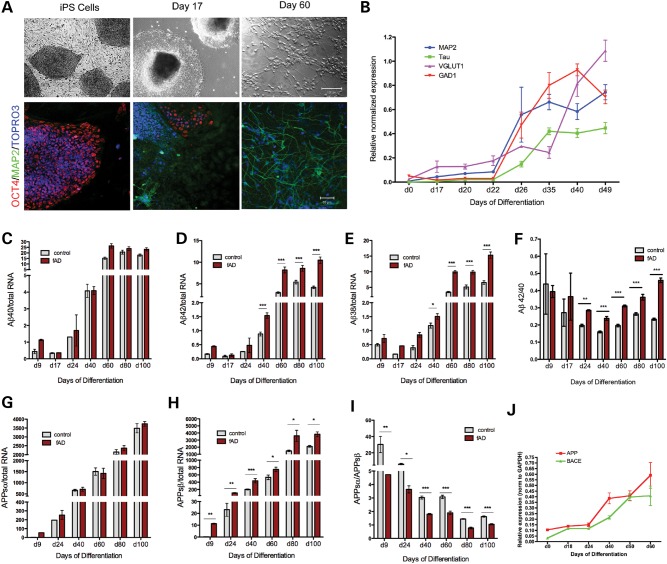
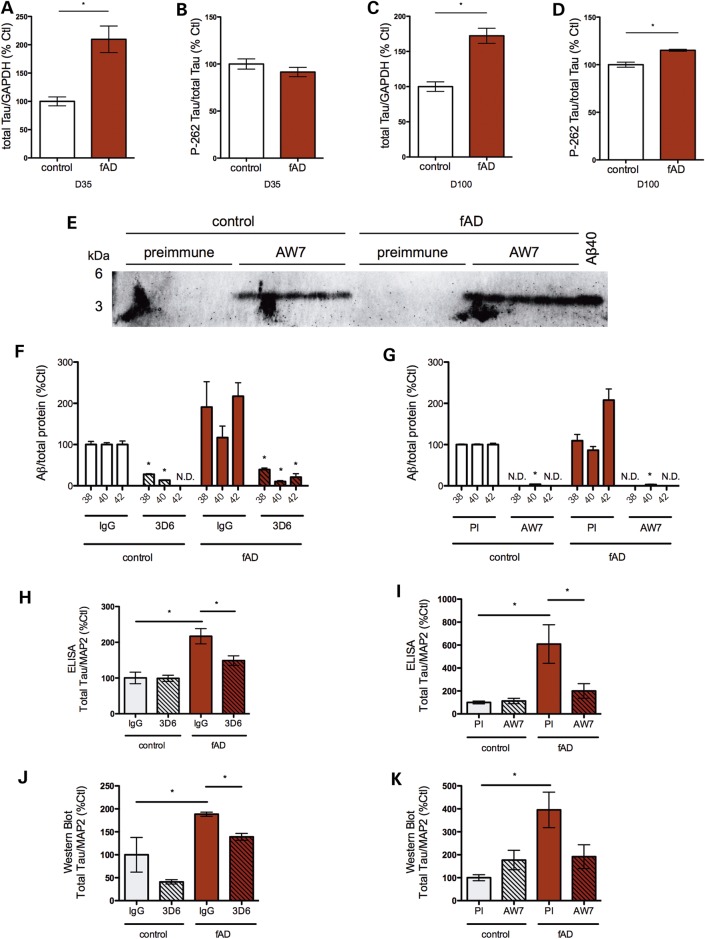
Alzheimer's disease (AD) is a complex neurodegenerative disorder characterized by extracellular plaques containing amyloid β (Aβ)-protein and intracellular tangles containing hyperphosphorylated Tau protein. Here, we describe the generation of inducible pluripotent stem cell lines from patients harboring the London familial AD (fAD) amyloid precursor protein (APP) mutation (V717I). We examine AD-relevant phenotypes following directed differentiation to forebrain neuronal fates vulnerable in AD. We observe that over differentiation time to mature neuronal fates, APP expression and levels of Aβ increase dramatically. In both immature and mature neuronal fates, the APPV717I mutation affects both β- and γ-secretase cleavage of APP. Although the mutation lies near the γ-secretase cleavage site in the transmembrane domain of APP, we find that β-secretase cleavage of APP is elevated leading to generation of increased levels of both APPsβ and Aβ. Furthermore, we find that this mutation alters the initial cleavage site of γ-secretase, resulting in an increased generation of both Aβ42 and Aβ38. In addition to altered APP processing, an increase in levels of total and phosphorylated Tau is observed in neurons with the APPV717I mutation. We show that treatment with Aβ-specific antibodies early in culture reverses the phenotype of increased total Tau levels, implicating altered Aβ production in fAD neurons in this phenotype. These studies use human neurons to reveal previously unrecognized effects of the most common fAD APP mutation and provide a model system for testing therapeutic strategies in the cell types most relevant to disease processes.


Figures

Figure 1.
Figure 1.
Characterization of the neuronal differentiation capacity of familial AD iPSC lines harboring the APP V717I mutation. Human iPSC lines were derived from a father and daughter with an fAD mutation (APP V717I). (A) Table summarizing human iPS lines used in this study. ND, not determined. (B) Schematic outlining α-, β- and γ-secretase cleavage sites in APP. Residue in red is V717, those in blue encode wild-type Aβ42. (C) Control and fAD lines were differentiated to neuronal fates using an embryoid aggregate protocol. After 40 days of differentiation, cells were fixed and immunostained for general neuronal markers such as MAP2, Tau and TuJ1, a marker of lower layer cortical neurons (Tbr1), a marker of upper layer cortical neurons (Cux1) and/or synaptic markers (PSD95, SYP, VGLUT1). Data shown are representative images from control and fAD lines. Scale bars = 50 μm. Magnified views of dotted boxes are shown as insets or adjacent to each image. (D) A representative single-unit waveform (∼15 μV, 3 ms), extracted from a voltage trace using extracellular whole well MEA (Axion Biosystems) recordings, is shown for both control and fAD lines. (E, F) After 40 days of differentiation, cells were lysed, RNA extracted and expression of 150 genes analyzed using the NanoString platform. Expression of general neuronal markers are shown in (E), cell fate-specific markers are shown in (F). For control, n = 20 and fAD, n = 10. Data were normalized to a panel of seven HK genes. AU, arbitrary units. Error bars represent SEM.
Figure 2.
Figure 2.
APP protein levels are altered and levels of secretases are unchanged in neurons with APPV717I mutation. Control and fAD APP V717I lines were differentiated to neuronal fates. (A, B) After 40 days, cells were lysed, RNA extracted and expression of 150 genes analyzed using the NanoString platform. Expression of APP family members are shown in (A) and components of α-, β- and γ-secretases in (B). Each bar represents data from nine independent wells collected from three rounds of differentiation. Data from four different iPSC lines are represented. Error bars represent SEM. (C) Representative Western blot analysis of selected genes following 100 days of differentiation.
Figure 3.
Figure 3.
FAD mutation (APPV717I) in forebrain neuronal cells leads to increased Aβ42 and Aβ38 production. Control and fAD iPSC lines were differentiated for 40–50 days to neuronal fates. Media conditioned on the cells for the final 48 h were collected, and Aβ 38, 40 and 42 were detected in a single well using a multiplex ELISA (MesoScale Discoveries). Following collection of media, cells were lysed and RNA collected for parallel analyses of markers of differentiation. Data are shown for Aβ42/40 ratio in individual clones (A) or pooled as control and APPV717I (fAD) (BH). For (B)–(H), Aβ data were generated from the two control and four fAD lines shown in (A) and averaged over 13 rounds of differentiation (YZ1 n = 45, YK26 n = 24, 1a n = 33, 1b n = 16, 2a n = 29, 2b n = 41). One-way ANOVA performed with Tukey's multiple comparisons test, **P < 0.01; ***P < 0.001. In (A), black asterisks show significance versus YZ1 and green asterisks show significance versus YK26. In (F)–(H), day 40 neurons were treated with vehicle or DAPT (5 μm) for the final 48 h of differentiation (n = 4–5 for each condition). Two-tailed t-tests were performed, **P < 0.01; ***P < 0.001. Error bars = SEM. Data normalized to RNA in (C)–(E) and total protein in F–H.
Figure 4.
Figure 4.
APP V717I mutation in forebrain neuronal cells leads to increased cleavage of APP at the β-secretase site. Control and fAD iPSC lines were differentiated for 40–50 days to neuronal fates. Media conditioned for the final 48 h were collected, and APPsα and APPsβ detected in a single well using a duplex ELISA (MesoScale Discovery). Following collection of media, cells were lysed and RNA collected for parallel analyses of markers of differentiation. (A) Ratio of APPsα/β in each line analyzed. Green asterisks represent significance relative to YZ1, red asterisks relative to YK26. (B) APPsα or (C) APPsβ levels normalized to total RNA from control and fAD neurons are shown, pooled by APP genotype. Data in (A) are combined from six differentiation rounds, for YZ1 n = 19, YK26 n = 11, 1A n = 8, 1B n = 15, 2a n = 26, and 2b n = 28; for (B) and (C) n = 20 for controls and n = 38 for fAD. One-way ANOVA performed with Tukey's multiple comparisons test, *P < 0.05; **P < 0.01; ***P < 0.001. (DF) Cells differentiated to neuronal fates for 50 days were treated with 5 μm DAPT or vehicle (DMSO) for the last 48 h of culture prior to lysis. Media were collected and APPsα and APPsβ measured using multiplex ELISA. In (D), ‘pre’ conditions show data from the media collected from the same wells 48 h prior to treatments. Green asterisks in (D) show significance relative to control cells treated with DMSO, and the purple asterisks in (D,F) show significance relative to fAD DMSO. Representative data from a single round of differentiation are shown, n = 3–5. (G, H) Neurons differentiated from control and fAD lines were immunostained and imaged using confocal microscopy. Data shown are representative images from control and fAD lines for APP, EEA-1 and MAP2 staining (G). Scale bars = 20 μm. Magnified views of dotted boxes within the middle panel are shown in the last panel. (H) APP/EEA-1 co-localization was measured using Zen Black software from Zeiss. Two lines for each conditioned were used. Number of cells counted: for control, n = 126 and for fAD, n = 115. Error bars represent SEM, ***P < 0.001.
Figure 5.
Figure 5.
Examination of APP cleavage products generated over differentiation time to mature neuronal fates. Control and APP V717I (fAD) iPSC lines were differentiated over 100 days to neuronal fates. (A) At multiple time points, cells were fixed and immunostained for a pluripotency marker (Oct4), a neuronal marker (MAP2) and a nuclear marker (TOPRO3). (B) Alternatively, cells were lysed following collection of media and RNA purified for qPCR analysis. Media were analyzed by ELISA to measure levels of Aβ (CF) and/or APPsα and APPsβ (GI). (J) qPCR analysis of APP and BACE mRNAs across the differentiation time course, normalized to GAPDH expression. For data in (B)–(J), error bars, SEM. For each comparison, a two-tailed t-test was performed, *P < 0.05; **P < 0.01; ***P < 0.001. For d9, d17, d24, n = 2–4, for d40, n = 70–100, for d60, d80, n = 5–10. Data normalized to total RNA in (C)–(E), (G) and (H).
Figure 6.
Figure 6.
Tau protein levels are increased in fAD neurons directed to a forebrain fate, which is reversed by treatment with Aβ-specific antibodies. Total Tau (A) and phospho-Tau (B) levels from control and fAD neurons differentiated for 35 days were determined by Western blotting and densitometry. Total Tau (C) and phospho-Tau (D) levels from control and fAD iPSCs differentiated for 100 days were determined by Western blotting and densitometry. (EK) Control and fAD neural progenitors (days 18–20) were treated with the Aβ-specific antibodies 3D6 (F, H, J) or AW7 (G, I, K) and compared with isotype-specific or preimmune serum, respectively, for 15 days. (E) Western blots of media probed for Aβ after pull down with protein Agarose-A/G beads. (F, G) Aβ ELISA data are shown from conditioned media following pull down of Aβ with either 3D6 or AW7. Treatment with a monoclonal Aβ antibody (3D6) was compared with its isotype control (IgG) (H, J) or else treatment with a polyclonal antibody (AW7) was compared with treatment with its preimmune serum (I, K). ELISA data for total Tau (H, I) and quantification by densitometry from Western blot (J, K) is shown for 3D6 and AW7 experiments, respectively. Fresh neural differentiation media with antibody was applied every 3 days. *P < 0.05; **P < 0.01; ***P < 0.001. PI, preimmune; ND, not detected; error bars, SEM.

Similar articles

Cited by

References

    1. Bertram L., Lill C.M., Tanzi R.E. The genetics of Alzheimer disease: back to the future. Neuron. 2010;68:270–281. - PubMed
    1. Wolfe M.S., Xia W., Ostaszewski B.L., Diehl T.S., Kimberly W.T., Selkoe D.J. Two transmembrane aspartates in presenilin-1 required for presenilin endoproteolysis and gamma-secretase activity. Nature. 1999;398:513–517. - PubMed
    1. Selkoe D.J., Podlisny M.B. Deciphering the genetic basis of Alzheimer's disease. Annu. Rev. Genomics Hum. Genet. 2002;3:67–99. - PubMed
    1. Bertram L., Tanzi R.E. The genetics of Alzheimer's disease. Prog. Mol. Biol. Transl. Sci. 2012;107:79–100. - PubMed
    1. Goate A., Chartier-Harlin M.C., Mullan M., Brown J., Crawford F., Fidani L., Giuffra L., Haynes A., Irving N., James L. Segregation of a missense mutation in the amyloid precursor protein gene with familial Alzheimer's disease. Nature. 1991;349:704–706. - PubMed

Publication types

MeSH terms