. 2014 Apr;7(4):459-69.
doi: 10.1242/dmm.014183. Epub 2014 Feb 13.

Chronic murine toxoplasmosis is defined by subtle changes in neuronal connectivity

Affiliations

Chronic murine toxoplasmosis is defined by subtle changes in neuronal connectivity

Alexandru Parlog et al. Dis Model Mech. 2014 Apr.

Abstract

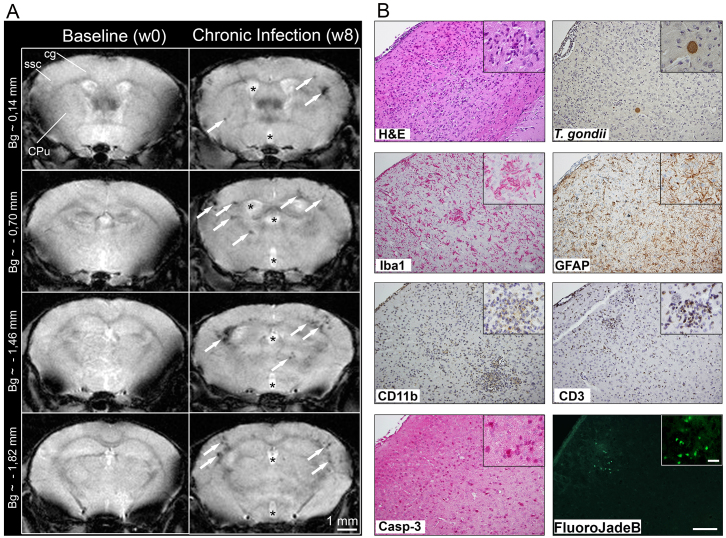
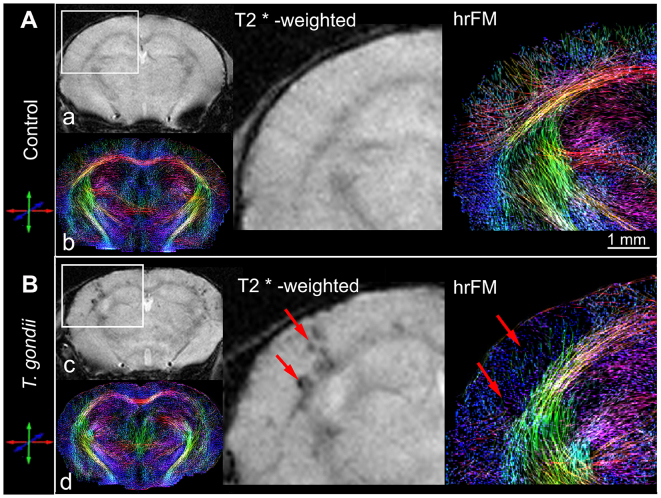
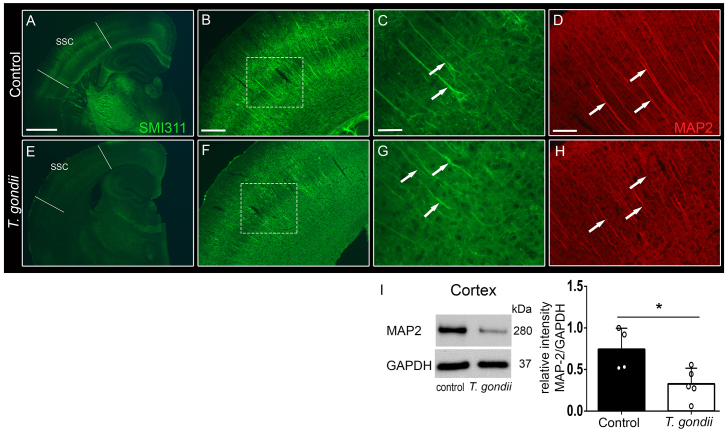
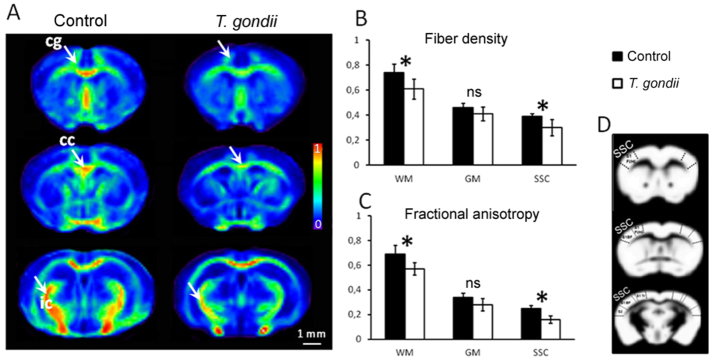
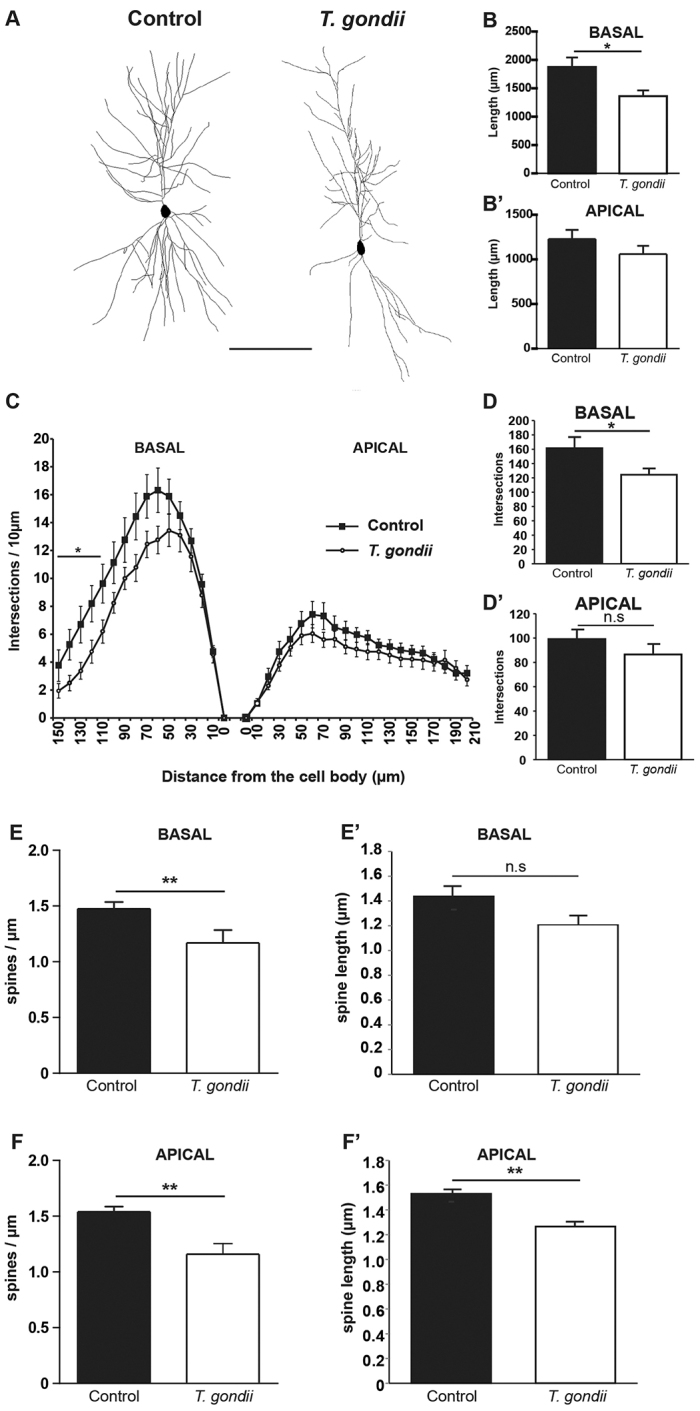
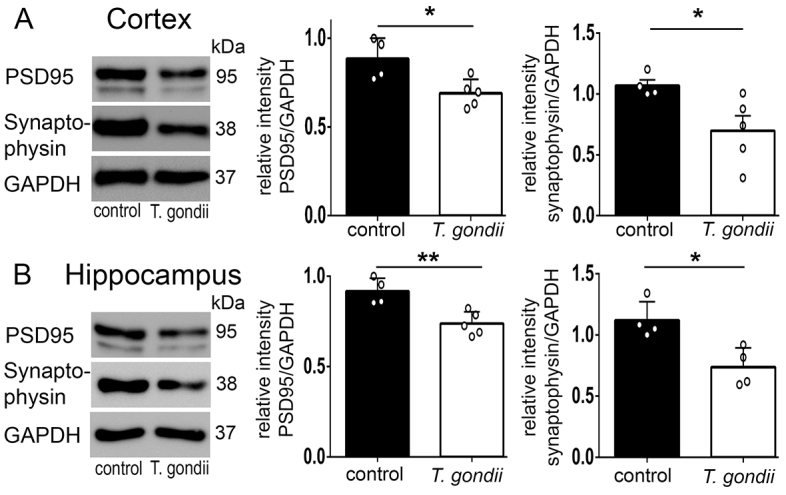
Recent studies correlate chronic Toxoplasma gondii (T. gondii) infection with behavioral changes in rodents; additionally, seropositivity in humans is reported to be associated with behavioral and neuropsychiatric diseases. In this study we investigated whether the described behavioral changes in a murine model of chronic toxoplasmosis are associated with changes in synaptic plasticity and brain neuronal circuitry. In mice chronically infected with T. gondii, magnetic resonance imaging (MRI) data analysis displayed the presence of heterogeneous lesions scattered throughout all brain areas. However, a higher density of lesions was observed within specific regions such as the somatosensory cortex (SSC). Further histopathological examination of these brain areas indicated the presence of activated resident glia and recruited immune cells accompanied by limited alterations of neuronal viability. In vivo diffusion-tensor MRI analysis of neuronal fiber density within the infected regions revealed connectivity abnormalities in the SSC. Altered fiber density was confirmed by morphological analysis of individual, pyramidal and granule neurons, showing a reduction in dendritic arbor and spine density within the SSC, as well as in the hippocampus. Evaluation of synapse efficacy revealed diminished levels of two key synaptic proteins, PSD95 and synaptophysin, within the same brain areas, indicating deficits in functionality of the synaptic neurotransmission in infected mice. Our results demonstrate that persistent T. gondii infection in a murine model results in synaptic deficits within brain structures leading to disturbances in the morphology of noninfected neurons and modified brain connectivity, suggesting a potential explanation for the behavioral and neuropsychiatric alterations.

Keywords: Behavioral manipulation; Neuronal connectivity; Parasites.


Figures

Fig. 1.
Fig. 1.
Pathological changes identified by MRI and histopathological examination of the murine brain chronically infected with T. gondii. (A) Representative T2*-weighted MR images, acquired before infection (baseline) and at 8 weeks post-infection (chronic), depicting T. gondii-induced brain microlesions throughout four axial brain slices. Note the changes in the lateral and third ventricle size (asterisks) and the localization of the lesions (arrows) within the cortex but also in the striatum and along the white matter fiber tracks (ssc, somatosensory cortex; cg, cingulum; CPu, caudate putamen; Bg, bregma). (B) In the cortical regions where hypointense T2*-weighted lesions were observed, hematoxylin-eosin and anti-T. gondii stainings revealed a higher density of cells, parenchymal micro-hemorrhage and the presence of intact T. gondii cysts. Closer examination using anti-Iba-1 and anti-GFAP antibodies indicated diffuse activation of microglia and astrocytes, respectively. This was followed by recruitment of CD11b-positive cells, indicating microglia cells as well as brain-recruited macrophages. Numerous recruited T cells were detected by anti-CD3 antibody. Apoptotic cells, highlighted by an anti-caspase-3 staining, were scattered throughout cortical areas. Fluoro-Jade B staining revealed a low number of degenerating neurons limited to the inflammatory foci (T. gondii-infected mice n=7; four to six coronal slides per mouse were analyzed). Scale bars in B: 100 μm, 20 μm in insets.
Fig. 2.
Fig. 2.
In vivo appraisal, by DT-MRI, of cortical injuries induced upon chronic T. gondii infection. Comparative visualization of T2*-weighted images (a,c) and high-resolution fiber maps (hrFM) (b,d) of control (A) and T. gondii-infected (B) mouse brains. Magnified views show the localization of T. gondii-induced injuries (arrows) in the somatosensory cortex. Note the changed cortical connectivity pattern (versus control) and the loss of fiber density in infected cortical areas. Brain connectivity maps were generated using a global optimization fiber tracking algorithm on data acquired at 9,4 Tesla. (Infected mice n=7, control mice n=9.)
Fig. 3.
Fig. 3.
Structural abnormalities in axons and dendrites were observed within the cortex of T. gondii-infected mice. Immunofluorescence stainings with the neuronal cytoskeleton marker anti-pan-neuronal neurofilament (SMI311) revealed structural abnormalities in the axons and dendritic trees within the SSC (boundaries shown by lines in A,E) of T. gondii-infected (E,F) versus control (A,B) mice. Detailed examination of the cortical layers (dashed squares) demonstrated defective morphology of noninfected pyramidal neurons of chronically infected mice (G, arrows), as indicated by reduced expression of SMI311, in contrast to normal expression in control animals (C, arrows). Parallel immunofluorescence staining against microtubule associated protein-2 (MAP2) confirmed the structural alterations of the dendrites within the SSC of T. gondii-infected mice (H, arrows) versus control mice (D, arrows). Five to six coronal slides per mouse were analyzed; n=3–4 mice per group. Scale bars: 1 mm in A and E, 200 μm in B and F, 50 μm in C and G, 100 μm in D and H. (I) Western blot analysis of MAP2 content in cortical extracts from control and infected mice, alongside GAPDH loading controls. Histograms indicate densitometric analysis of blots, expressed as mean±s.e.m. Analysis was performed in three independent experiments. The circles show individual values, from one representative experiment. *P<0.05.
Fig. 4.
Fig. 4.
In vivo DT-MRI-based quantitative evaluation of brain microstructural alterations induced by chronic T. gondii infection. (A) Group-averaged (control versus T. gondii) axial fiber density (FD) maps, generated after spatial normalization to a mouse brain template, show a general pattern of fiber loss particularly evident in white matter areas (arrows; cg, cingulum; cc, corpus callosum; ic, internal capsule) of T. gondii-infected mice. The fiber density values were normalized from 0 (no fibers mapped) to 1 (maximum density of fibers depicted in averaged FD maps across the whole population of investigated animals). (B,C) Quantitative comparison of the FD and fractional anisotropy (FA) values in white matter (WM), gray matter (GM) and the somatosensory cortex (SSC) of control and T. gondii-infected animals. Note the statistically significant reduction of FD and FA in WM and SSC brain areas upon chronic T. gondii infection. Lower FD and FA values were quantified within the GM brain area, without reaching the threshold of statistical significance. (D) Maps illustrate the brain masks [WM (dark area), GM (white area) and SSC] used for the quantitative analysis presented in B and C. The WM and GM masks were generated after segmentation of spatially normalized and averaged T2-weighted images. SSC was manually selected, according to Paxinos mouse brain atlas. All data are expressed as mean±s.e.m.; T. gondii-infected mice n=7, control mice n=9. *P<0.05; ns, not significant.
Fig. 5.
Fig. 5.
Morphological analysis of layer II/III pyramidal neurons within the cortices of T. gondii-infected and control mice. (A) Shows two examples of rendered pyramidal neurons, consisting of stacks of multiple optical sections from control and T. gondii-infected mice. Note the simplified dendritic architecture in the neuron from the T. gondii-infected brain. Scale bar: 100 μm. (B,B′) The graphs compare total dendritic length for the basal and apical dendritic tree in neurons of control versus infected mouse brain. (C) Sholl analysis, plotting dendritic complexity in relation to the distance from the cell body for the basal (left) and apical (right) dendrites of layer II/III neurons of control and infected mouse brain. (D,D′) The graphs show the total dendritic complexity for the basal (D) and apical (D′) dendritic tree of layer II/III neurons of control and infected mouse brain. (E,E′) Depicts dendritic spine density (E) and dendritic spine length (E′) for the basal dendrites of layer II/III neurons of control and infected mouse brain. (F,F′) Show dendritic spine density (F) and dendritic spine length (F′) for the apical dendrites of layer II/III neurons of control and infected mouse brain. Analysis was performed in three independent experiments. All data are expressed as mean±s.e.m.; n=3–4 mice per group. *P<0.05; **P<0.01; ns, not significant.
Fig. 6.
Fig. 6.
Impaired expression of synaptic-related proteins in T. gondii-infected brains. Representative blots from the cortex (A) and hippocampus (B) tissue extracts of control and T. gondii-infected mice, used for PSD95 (thick band) and synaptophysin protein semi-quantification. Densitometric analysis of PSD95 and synaptophysin protein levels revealed statistically significant reductions in T. gondii-infected mice, suggesting deficits of the synaptic cleft physiology. Analysis was performed in three independent experiments. Data are expressed as mean±s.e.m. The circles show individual values from one representative experiment. *P<0.05 and ** P<0.01.

References

    1. Al-Chalabi A, Miller C. C. (2003). Neurofilaments and neurological disease. Bioessays 25, 346–355 - PubMed
    1. Anticevic A., Brumbaugh M. S., Winkler A. M., Lombardo L. E., Barrett J., Corlett P. R., Kober H., Gruber J., Repovs G., Cole M. W., et al. (2013). Global prefrontal and fronto-amygdala dysconnectivity in bipolar I disorder with psychosis history. Biol. Psychiatry 73, 565–573 - PMC - PubMed
    1. Arling T. A., Yolken R. H., Lapidus M., Langenberg P., Dickerson F. B., Zimmerman S. A., Balis T., Cabassa J. A., Scrandis D. A., Tonelli L. H., et al. (2009). Toxoplasma gondii antibody titers and history of suicide attempts in patients with recurrent mood disorders. J. Nerv. Ment. Dis. 197, 905–908 - PubMed
    1. Berdoy M., Webster J. P., Macdonald D. W. (1995). Parasite-altered behaviour: is the effect of Toxoplasma gondii on Rattus norvegicus specific? Parasitology 111, 403–409 - PubMed
    1. Berdoy M., Webster J. P., Macdonald D. W. (2000). Fatal attraction in rats infected with Toxoplasma gondii. Proc. Biol. Sci. 267, 1591–1594 - PMC - PubMed

Publication types

MeSH terms