. 2014 Apr 1;306(7):G622-30.
doi: 10.1152/ajpgi.00372.2013. Epub 2014 Feb 13.

Fructose stimulates GLP-1 but not GIP secretion in mice, rats, and humans

Affiliations

Fructose stimulates GLP-1 but not GIP secretion in mice, rats, and humans

Rune E Kuhre et al. Am J Physiol Gastrointest Liver Physiol. .

Abstract

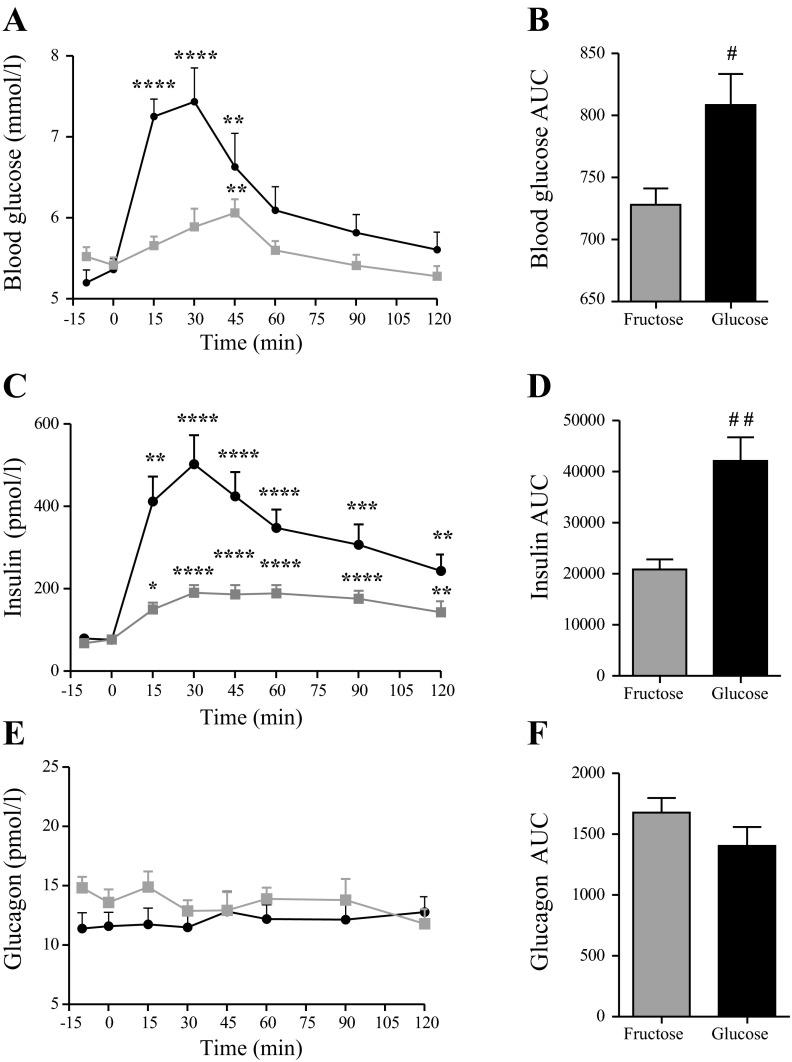
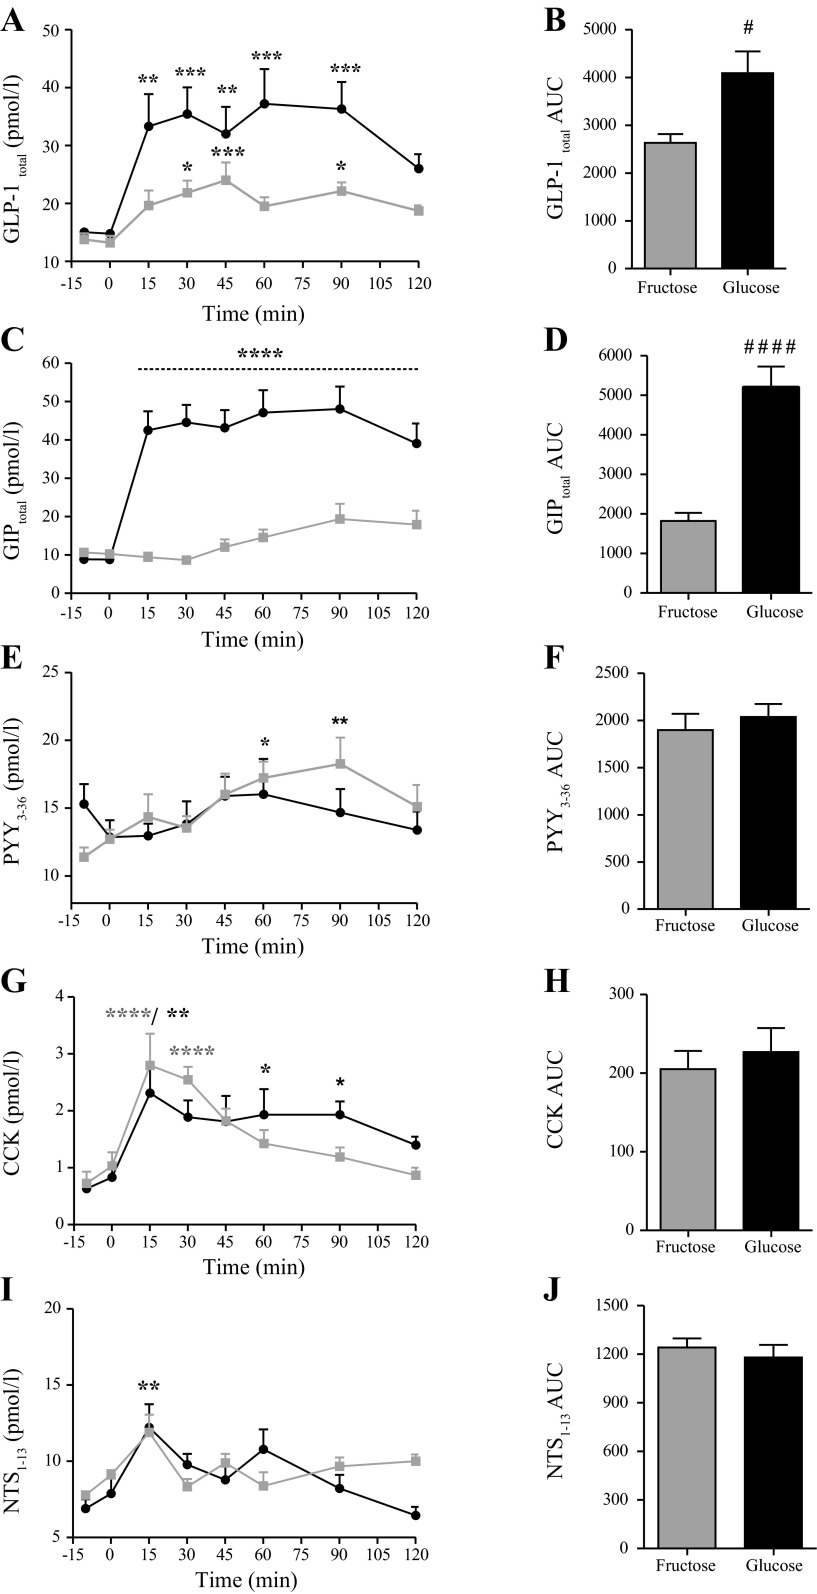
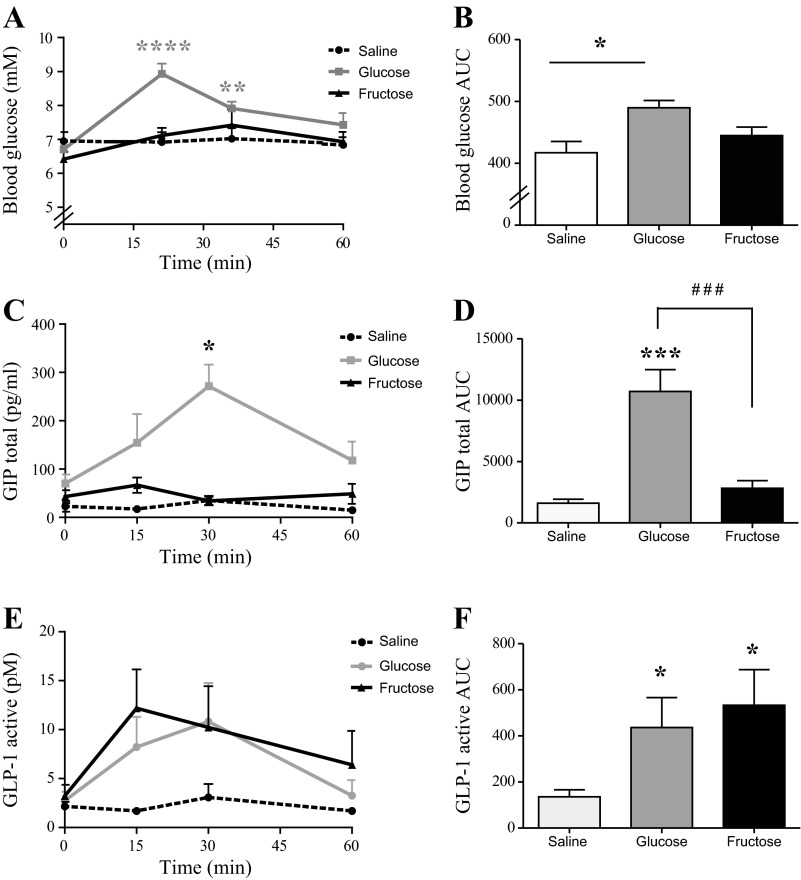
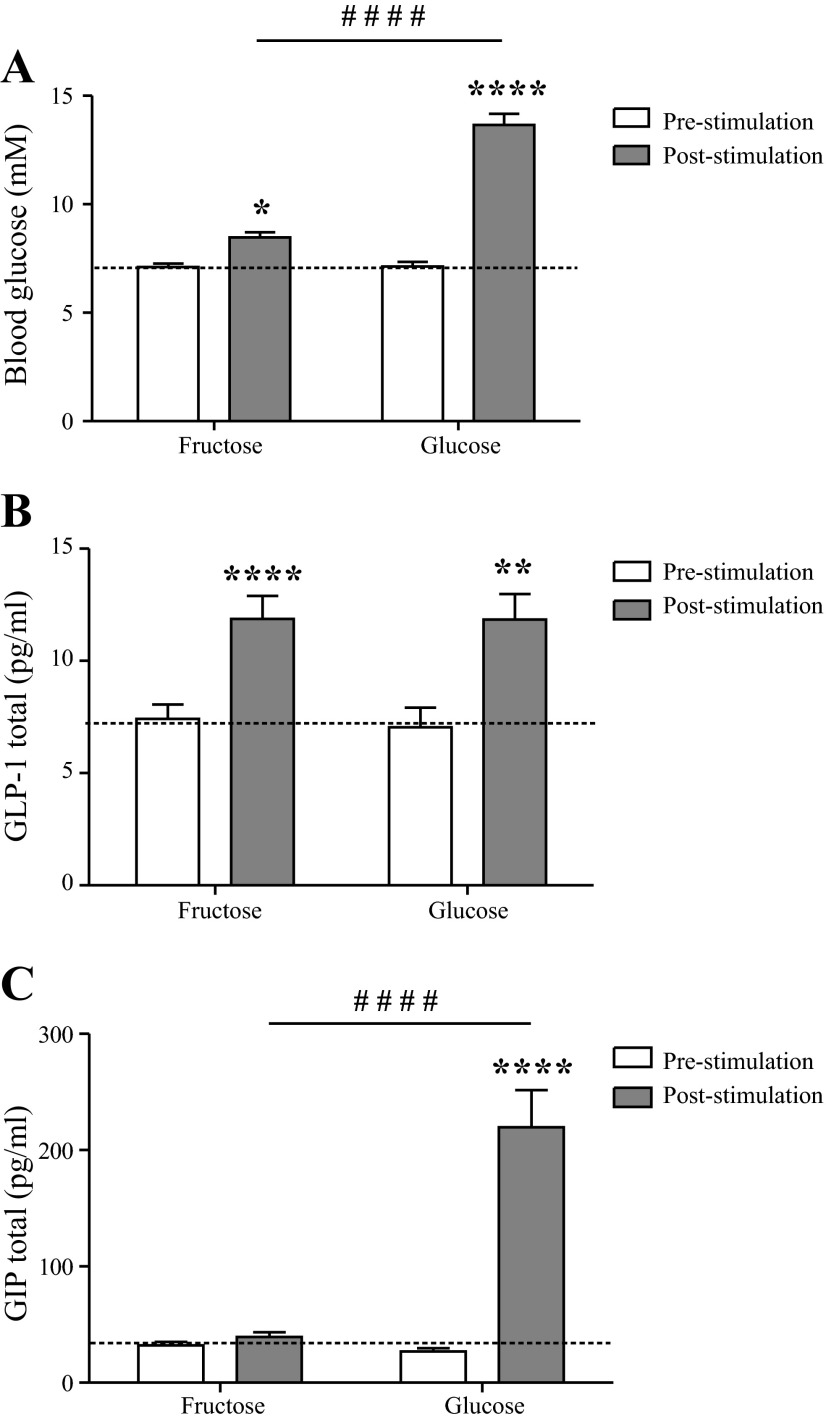
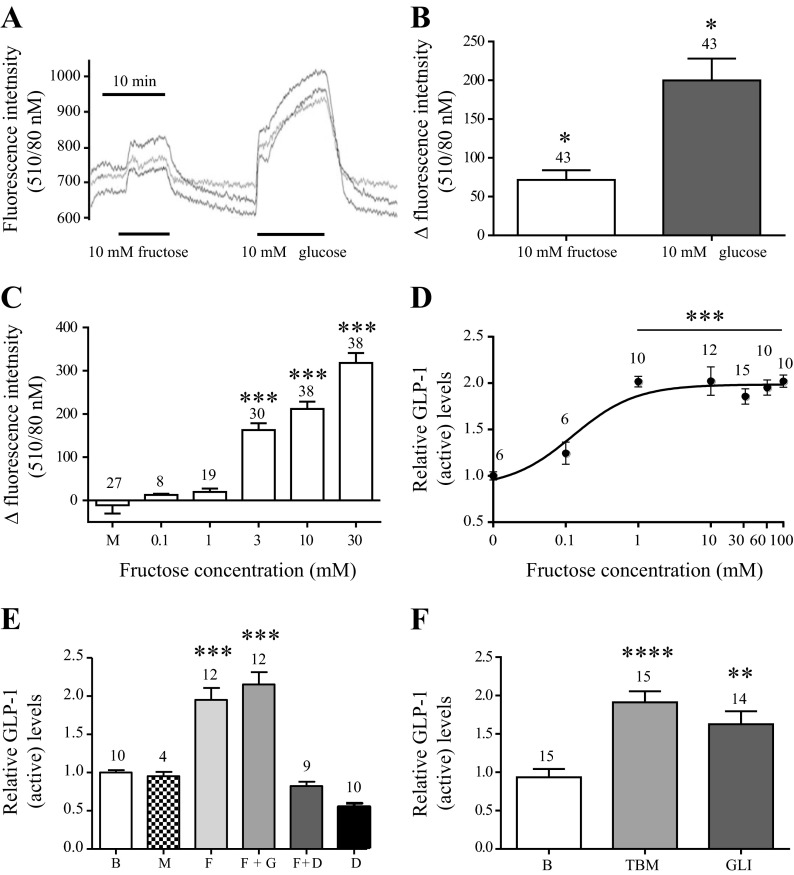
Nutrients often stimulate gut hormone secretion, but the effects of fructose are incompletely understood. We studied the effects of fructose on a number of gut hormones with particular focus on glucagon-like peptide 1 (GLP-1) and glucose-dependent insulinotropic polypeptide (GIP). In healthy humans, fructose intake caused a rise in blood glucose and plasma insulin and GLP-1, albeit to a lower degree than isocaloric glucose. Cholecystokinin secretion was stimulated similarly by both carbohydrates, but neither peptide YY3-36 nor glucagon secretion was affected by either treatment. Remarkably, while glucose potently stimulated GIP release, fructose was without effect. Similar patterns were found in the mouse and rat, with both fructose and glucose stimulating GLP-1 secretion, whereas only glucose caused GIP secretion. In GLUTag cells, a murine cell line used as model for L cells, fructose was metabolized and stimulated GLP-1 secretion dose-dependently (EC50 = 0.155 mM) by ATP-sensitive potassium channel closure and cell depolarization. Because fructose elicits GLP-1 secretion without simultaneous release of glucagonotropic GIP, the pathways underlying fructose-stimulated GLP-1 release might be useful targets for type 2 diabetes mellitus and obesity drug development.

Keywords: enteroendocrine axis; gastric inhibitory peptide; glucagon-like peptide-1.


Figures

Fig. 1.
Fig. 1.
Blood glucose and plasma insulin and glucagon responses to oral glucose and fructose challenge in healthy humans. Mean values + 1 SE are shown in response to oral glucose (black) and fructose (gray) stimulation. Total area under the curve (AUC) values are shown for comparison between treatments. A: blood glucose (mM); B: blood glucose AUC values (min × mM); C: plasma insulin (pM); D: plasma insulin AUC values (min × pM); E: plasma glucagon (pM); F: plasma glucagon AUC values (min × pM). *Within-group significance compared with baseline (mean value for −15 and 0 min control samples). #Level of between-group significance. Within-group significance was tested by one-way ANOVA for repeated measurements followed by Bonferroni post hoc test. Between-group significance was tested by two-tailed paired t-test on AUC values. */#P < 0.05, **/##P < 0.01, ***P < 0.001, and ****P < 0.0001, n = 9.
Fig. 2.
Fig. 2.
Enteroendocrine hormone responses to oral glucose and fructose challenge in healthy humans. Mean values + 1 SE are shown in response to oral (75 g in 300 ml water) glucose (black) and fructose (gray) intake. Total AUC values are shown for comparison between treatments. A: plasma total glucagon-like peptide-1 (GLP-1total, pM); B: plasma GLP-1total AUC values (min × pM); C: plasma total glucose-dependent insulinotropic polypeptide (GIPtotal, pM); D: total plasma GIPtotal AUC values (min × pM); E: plasma peptide YY (PYY)3–36 values (pM); F: Plasma PYY3–36 AUC values (min × pM); G: plasma cholecystokinin (CCK) values (pM); H: plasma CCK AUC values (min × pM); I: plasma neutotensin (NTS)1–13 values (pM); J: plasma NTS1–13 AUC values (min × pM). *Within-group significance compared with base level (mean value for −15 and 0 min control samples). #Between-group significance. Significance was tested by one-way ANOVA for repeated measurements followed by Bonferroni post hoc test or paired t-test. #/*P < 0.05, **P < 0.01, ***P < 0.001, and ####/****P < 0.0001, n = 9.
Fig. 3.
Fig. 3.
Blood glucose and plasma GLP-1 and GIP responses to oral glucose and fructose stimulation in the rat. Mean values + 1 SE are shown in response to oral glucose (gray), fructose (blue), and saline (black) intake. A: blood glucose levels; B: blood glucose AUC levels (min × mM); C: plasma GIPtotal levels (pg/ml); D: plasma GIPtotal AUC values (min × pg/ml); E: plasma GLP-1active concentrations (pM); F: plasma GLP-1active AUC values (min × pM). Between-group significance was tested by two-tailed paired t-test on AUC values. *Within-group significance. #Between group significance. **P < 0.01, ###/***P < 0.001, *P < 0.05, and ****P < 0.0001 relative to base level, n = 7 for glucose and n = 6 for fructose and saline.
Fig. 4.
Fig. 4.
Blood glucose and plasma GLP-1 and GIP responses to oral glucose and fructose stimulation in the mouse. Values are shown as means ± 1 SE at 0 min (white bars, base level) and 6 min (gray bars, response). A: blood glucose concentrations (mM); B: plasma GLP-1total levels (pg/ml); C: plasma GIPtotal concentrations (pg/ml). Data were analyzed by one-way ANOVA followed by Bonferroni post hoc test or Student's t-test. *Within-group significance. #Between-group significance. ****/####P < 0.0001, ***P < 0.001, **P < 0.01, and *P < 0.05, n = 31/group in A and B and 24–29/group in C.
Fig. 5.
Fig. 5.
Fructose is metabolized by the GLUTag cell and stimulates GLP-1 secretion dose dependently by ATP-sensitive potassium (KATP) channel closure. Data are presented as mean values ± 1 SE with sample size indicated over the respective bars. Responses are shown relative to base level (B) secretion measured in parallel on the same day. A: representative trace of changes in intracellular NAD(P)H levels [fluorescence intensity (340/10 nM)] in response to 10 mM fructose/glucose. Each trace represents one cell. B: collected changes in NAD(P)H levels in response to 10 mM fructose and glucose. C: changes in NAD(P)H levels in response to depicted concentrations series of fructose (F) and mannitol (M) (osmolarity control). D: relative GLP-1active levels in response to concentrations of fructose or as indicated. EC50 = 0.155 mM. E: relative GLP-1active secretion levels in response to mannitol (100 mM), fructose (10 mM), fructose (10 mM) + gliclazide (10 μM) (F + GLI), fructose (10 mM) + diazoxide (340 μm) (F + D), and diazoxide (340 μM) (D). F: relative GLP-1active levels in response to 10 μM tolbutamide (TBM) and gliclazide (GLI). Statistical significance was tested by Student's t-test (B) or one-way ANOVA analysis followed by Bonferroni post hoc test (CF). *P < 0.05, **P < 0.01, ***P < 0.001, and ****P < 0.0001 relative to base level.

Similar articles

Cited by

References

    1. Bismut H, Hers HG, Van Schaftingen E. Conversion of fructose to glucose in the rabbit small intestine. A reappraisal of the direct pathway. Eur J Biochem 213: 721–726, 1993 - PubMed
    1. Bray GA. How bad is fructose? Am J Clin Nutr 86: 895–896, 2007 - PubMed
    1. Curry DL. Effects of mannose and fructose on the synthesis and secretion of insulin. Pancreas 4: 2–9, 1989 - PubMed
    1. Drucker DJ, Jin T, Asa SL, Young TA, Brubaker PL. Activation of proglucagon gene transcription by protein kinase-A in a novel mouse enteroendocrine cell line. Mol Endocrinol 8: 1646–1655, 1994 - PubMed
    1. Gopher A, Vaisman N, Mandel H, Lapidot A. Determination of fructose metabolic pathways in normal and fructose-intolerant children: a 13C NMR study using [U-13C]fructose. Proc Natl Acad Sci USA 87: 5449–5453, 1990 - PMC - PubMed

Publication types

MeSH terms