. 2014 Sep;125(9):1878-88.
doi: 10.1016/j.clinph.2014.01.011. Epub 2014 Jan 29.

Rapid acquisition of auditory subcortical steady state responses using multichannel recordings

Affiliations

Rapid acquisition of auditory subcortical steady state responses using multichannel recordings

Hari M Bharadwaj et al. Clin Neurophysiol. 2014 Sep.

Abstract

Objective: Auditory subcortical steady state responses (SSSRs), also known as frequency following responses (FFRs), provide a non-invasive measure of phase-locked neural responses to acoustic and cochlear-induced periodicities. SSSRs have been used both clinically and in basic neurophysiological investigation of auditory function. SSSR data acquisition typically involves thousands of presentations of each stimulus type, sometimes in two polarities, with acquisition times often exceeding an hour per subject. Here, we present a novel approach to reduce the data acquisition times significantly.

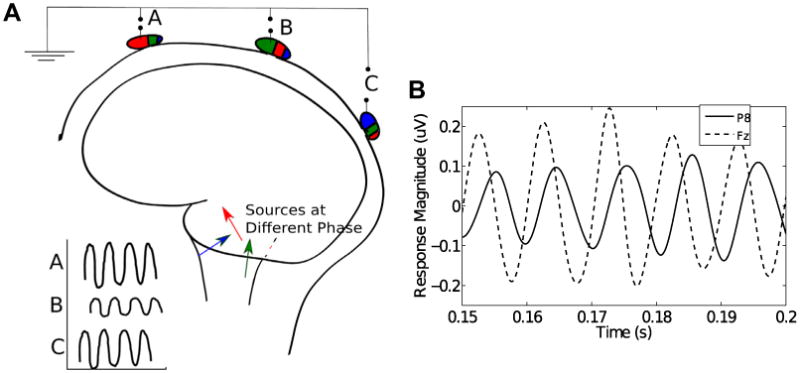
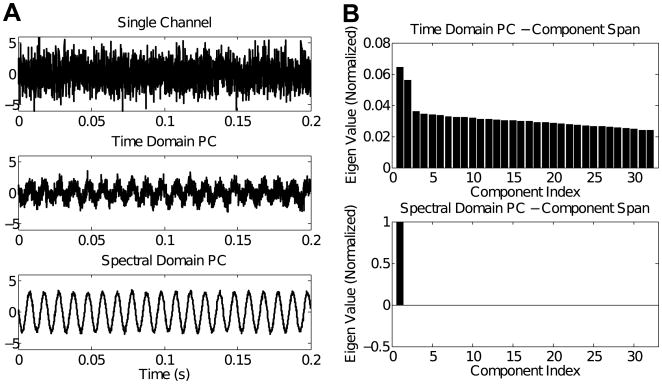
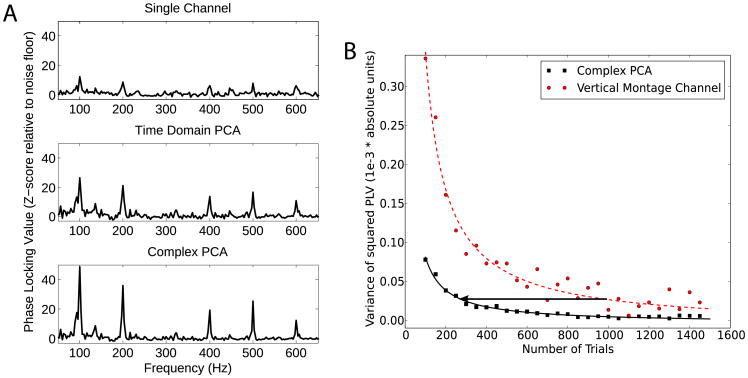
Methods: Because the sources of the SSSR are deep compared to the primary noise sources, namely background spontaneous cortical activity, the SSSR varies more smoothly over the scalp than the noise. We exploit this property and extract SSSRs efficiently, using multichannel recordings and an eigendecomposition of the complex cross-channel spectral density matrix.

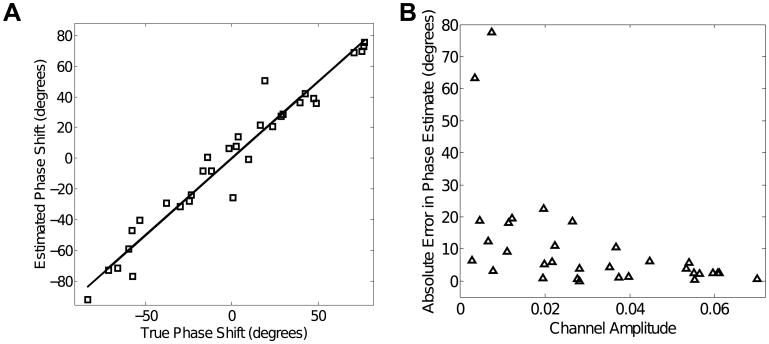
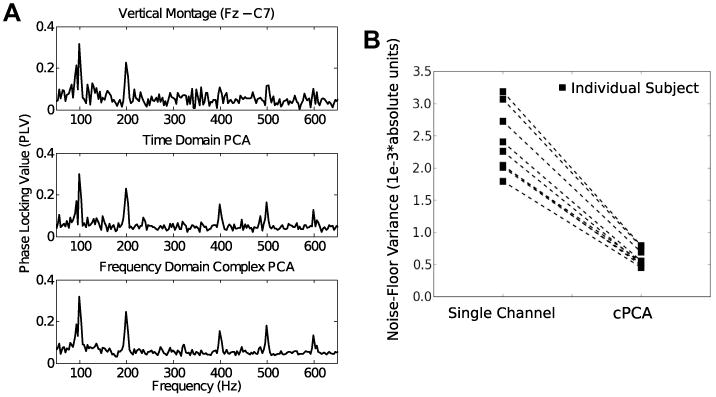
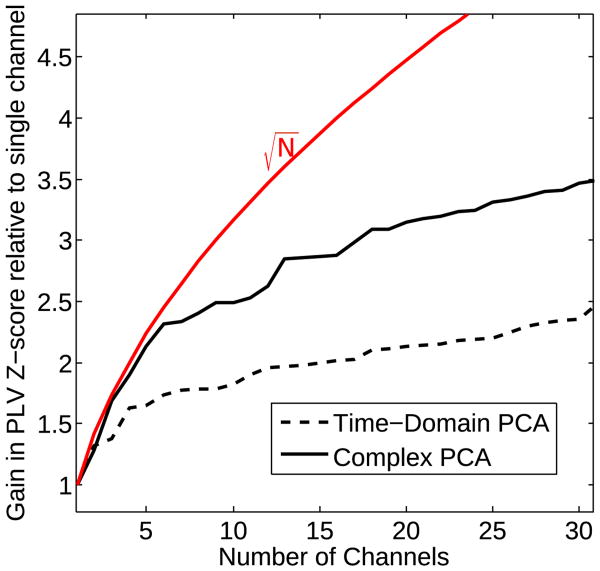
Results: Our proposed method yields SNR improvement exceeding a factor of 3 compared to traditional single-channel methods.

Conclusions: It is possible to reduce data acquisition times for SSSRs significantly with our approach.

Significance: The proposed method allows SSSRs to be recorded for several stimulus conditions within a single session and also makes it possible to acquire both SSSRs and cortical EEG responses without increasing the session length.

Keywords: Auditory brainstem response; Complex principal component analysis; Frequency following response; Multichannel; Rapid acquisition.


Figures

Fig. 1
Fig. 1
(A) A schematic illustration of the possible origin of phase differences of the SSSR recorded from different scalp electrodes. Each neural generator, shown as three different colored arrows, is phased-locked to the stimulus, but at a different unique phase. Moreover, the generators contribute different amounts to different scalp locations, as illustrated by the proportion of the ellipses shaded with the corresponding colors. This results in phase misalignment between the effective total response at different recording sites. (B) Real SSSR obtained from a typical subject from two distinct scalp locations (relative to the average potential between the two earlobes) showing phase differences in the response. The data is filtered between 90 and 110 Hz to emphasize the response at the fundamental stimulus frequency of 100 Hz. (For interpretation of the references to colour in this figure legend, the reader is referred to the web version of this article.)
Fig. 2
Fig. 2
Simulation results: (A) The trial-averaged response at a single simulated channel (top panel), the extracted SSSR using time-domain PCA (middle panel), and the extracted SSSR using cPCA (bottom panel) are shown. Though the time-domain PCA has a greater SNR compared to any single channel, the cPCA method produces SSSRs of significantly higher SNR than does time-domain PCA. (B) The normalized eigenweights for the different principal components using traditional time-domain PCA (top panel) and cPCA (bottom panel) for the simulated EEG data. The cPCA method captures most of the signal energy in one component, showing that one weight vector accounts for both the magnitude and phase variations across channels.
Fig. 3
Fig. 3
Simulation results: (A) Relationship between the true simulated phase and the phase shifts estimated using the cPCA method for a typical simulation. The cPCA method produces accurate estimates of the phase delay necessary to align the channels. (B) Phase estimation errors are inversely related to the channel weights (shown for a typical simulation). Specifically, the channels with larger phase estimation error have a lower relative weight, and hence contribute weakly to the final extracted SSSR, while channels with accurately estimated phases are weighted more strongly.
Fig. 4
Fig. 4
(A) Raw phase-locking value (PLV) scores obtained from a representative subject using a single channel (top), time-domain PCA (middle), and cPCA (bottom) for a 100 Hz click-train burst stimulus. The PLV obtained using the three methods are comparable at signal frequencies (multiples of 100 Hz), but differ in the variability of the noise floor. The cPCA method hence produces PLV values that are statistically more robust than the other methods. (B) The noise floor variance estimated using the bootstrap procedure is shown for each of the nine subjects for the single-channel montage and for the multichannel estimate using the cPCA method. It is clear from visual inspection, and confirmed using the permutation procedure, that the noise-variance was smaller using cPCA that for the other methods for every subject, rendering the responses more easily distinguishable from noise.
Fig. 5
Fig. 5
Individual subject results: (A) Z-scored PLV values obtained from a representative subject using a single channel (top), time-domain PCA (middle), and cPCA (bottom) for the 100 Hz click-train burst stimuli. Here the noise-floor in all three cases has been normalized to have a mean of zero and a variance of one (scaling the PLV into a z-score). The z-scores at the harmonics of 100 Hz thus indicate the SNR obtained using the three methods. The cPCA method has a significantly higher SNR than both a single-channel and the time-domain PCA. (B) Comparison of noise floor variance estimates as a function of the number of trials between the cPCA method and the traditional vertical montage channel from individual subject data. The arrow highlights the number of trials that may be required using the cPCA approach to obtain similar levels of noise suppression as from 1000 trials using the traditional approach.
Fig. 6
Fig. 6
Real EEG results: The gain in SNR as the number of recording channels is increased, quantified as the gain in z-score relative to using a single channel, time-domain PCA, and cPCA methods. As more channels are added, both the time-domain PCA and the cPCA methods provide a gain in SNR, but the cPCA method produces larger improvements. The theoretical gain that would be obtained by combining independent, identically distributed measurements is shown in red for reference. Initially, the SNR gain approaches the reference curve, but then quickly plateaus. This suggests that the noise source activity captured in different channels are nearly independent when there are a small number of (optimally selected) channels included, but that as the electrode density increases, the noise in the different channels become correlated. Note, however that the rapid increase and subsequent plateau in SNR with increasing number of channels is obtained given the a posteriori knowledge of the best channels to select. In practice, the gain in SNR with increasing number of channels would be more gradual, since the channels would not be selected optimally from among a large set, but would instead be selected a priori. (For interpretation of the references to colour in this figure legend, the reader is referred to the web version of this article.)
Fig. 7
Fig. 7
Simulations showing the effect of narrowband SNR in the raw recording on the non-linear relationship between the estimated PLV and the true PLV. At sufficiently high narrowband SNR, the PLV estimates converge to the true PLV. Since the cPCA method is more likely to push the narrowband SNR into this convergence region, the PLV calculated from the SSSR extracted using the cPCA method is more likely to represent the true PLV of the underlying response than are traditional methods.

Comment in

References

    1. Aiken SJ, Picton TW. Envelope and spectral frequency-following responses to vowel sounds. Hear Res. 2008;245:35–47. - PubMed
    1. Aiken SJ, Picton TW. Envelope following responses to natural vowels. Audiol Neurootol. 2006;11:213–32. - PubMed
    1. Baillet S, Mosher JC, Leahy RM. Electromagnetic brain mapping. Sig Proc IEEE. 2001;18:14–30.
    1. Bickel PJ, Freedman DA. Some asymptotic theory for the bootstrap. Ann Stat. 1981;9:1196–217.
    1. Bokil H, Purpura K, Schoffelen JM, Thomson D, Mitra P. Comparing spectra and coherences for groups of unequal size. J Neurosci Meth. 2007;159:337–45. - PubMed

Publication types

LinkOut - more resources