. 2014 Apr 15;74(8):2152-9.
doi: 10.1158/0008-5472.CAN-13-0813. Epub 2014 Feb 13.

Detection of brain tumor cells in the peripheral blood by a telomerase promoter-based assay

Affiliations

Detection of brain tumor cells in the peripheral blood by a telomerase promoter-based assay

Kelly M Macarthur et al. Cancer Res. .

Abstract

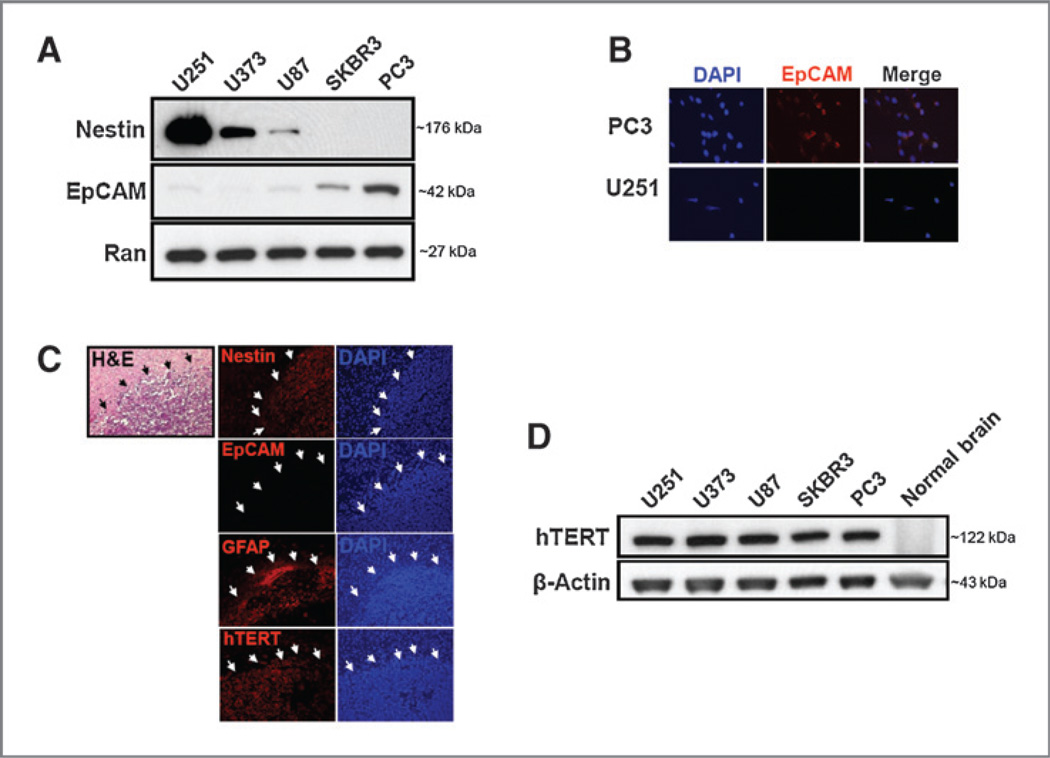
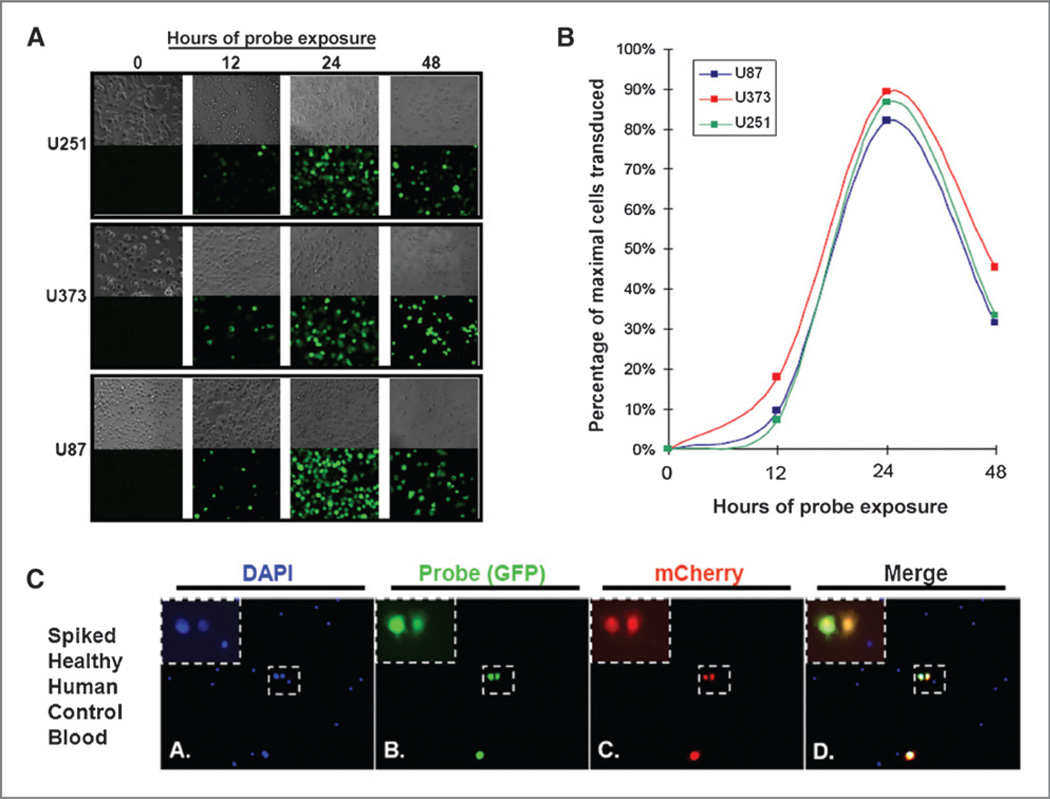
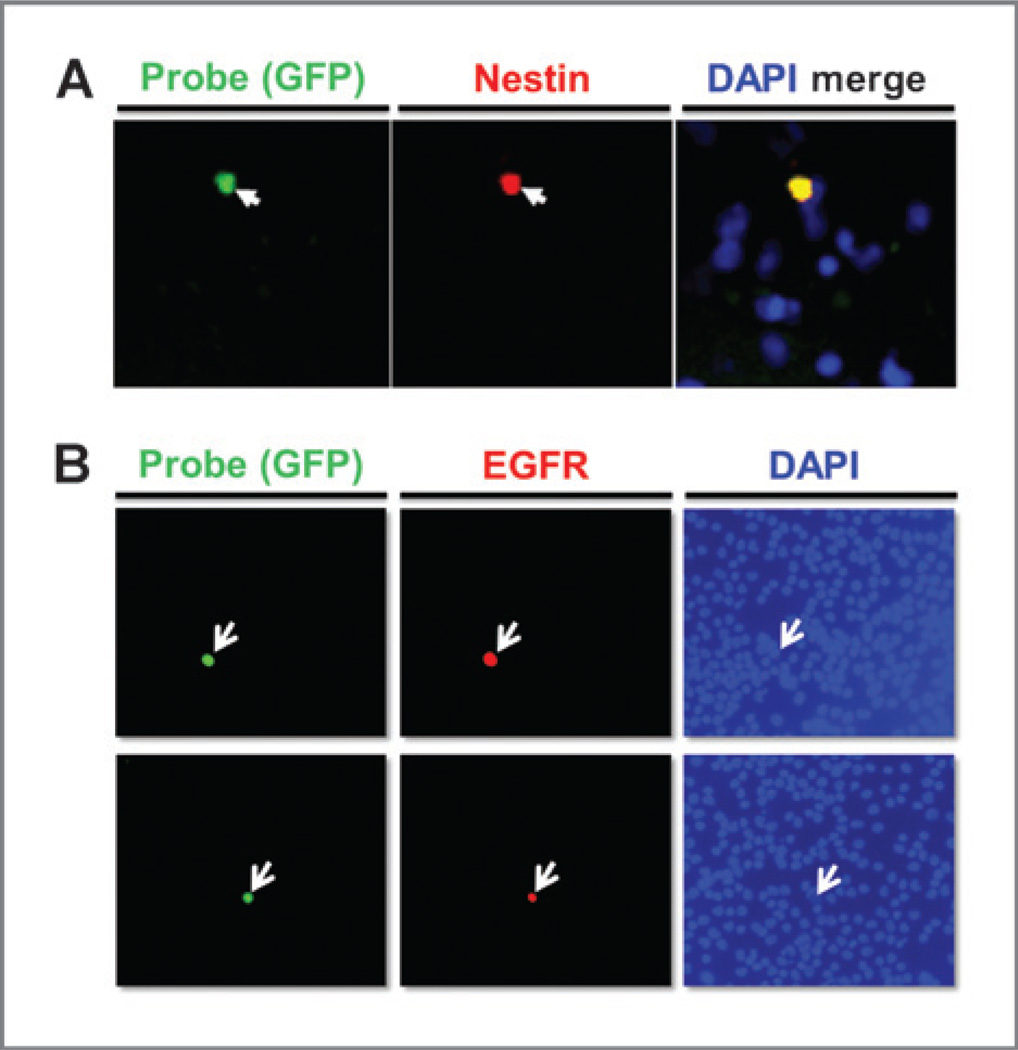
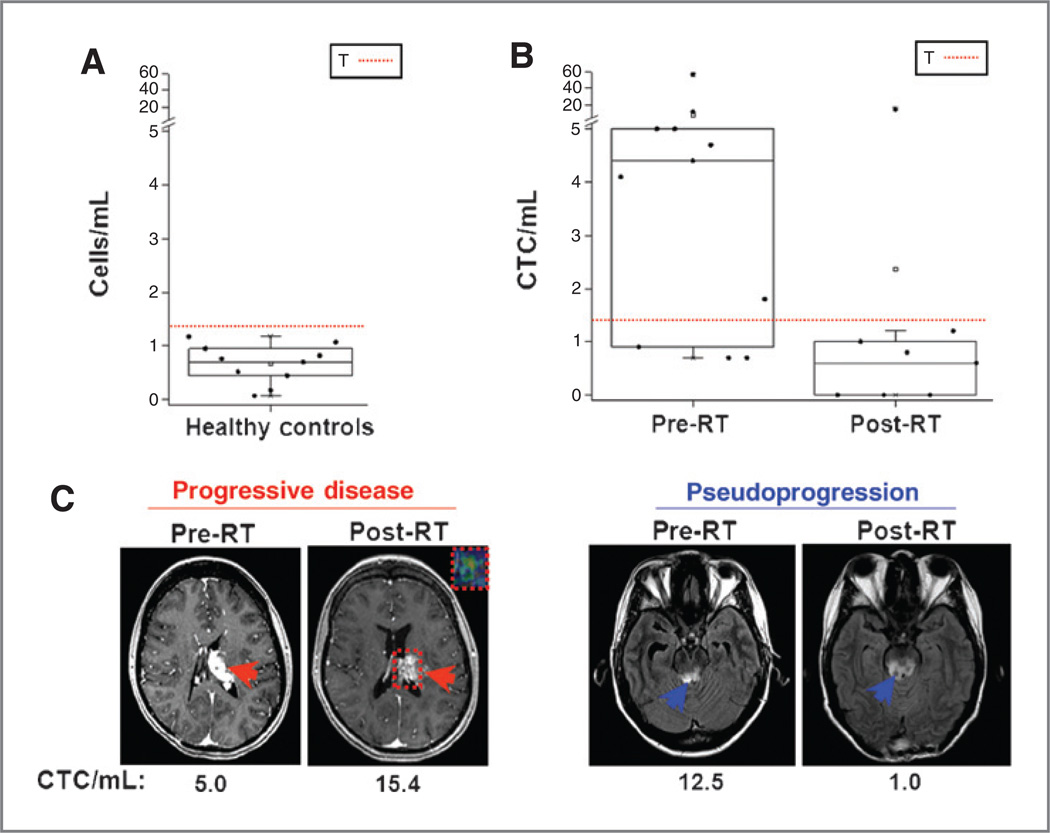
Blood tests to detect circulating tumor cells (CTC) offer great potential to monitor disease status, gauge prognosis, and guide treatment decisions for patients with cancer. For patients with brain tumors, such as aggressive glioblastoma multiforme, CTC assays are needed that do not rely on expression of cancer cell surface biomarkers like epithelial cell adhesion molecules that brain tumors tend to lack. Here, we describe a strategy to detect CTC based on telomerase activity, which is elevated in nearly all tumor cells but not normal cells. This strategy uses an adenoviral detection system that is shown to successfully detect CTC in patients with brain tumors. Clinical data suggest that this assay might assist interpretation of treatment response in patients receiving radiotherapy, for example, to differentiate pseudoprogression from true tumor progression. These results support further development of this assay as a generalized method to detect CTC in patients with cancer.


Conflict of interest statement

Disclosure of Potential Conflicts of Interest

The coauthors are employees of the University of Pennsylvania, which has a patent pending on components of the technology described in this manuscript. J.F. Dorsey, G.D. Kao, and S.M. Hahn are cofounders of Liquid Biotech LLC (Penn CTT/ UpSTART). No potential conflicts of interest were disclosed by the other authors.

Figures

Figure 1
Figure 1
Preclinical validation of telomerase-based assay for glioma tumor cell detection. A, Western blot analysis to assess Nestin and EpCAM expression was performed on human glioma cells in culture (U251, U373, and U87), alongside Nestin-negative controls: human breast cancer and human prostate cancer cell lines (SKBR3 and PC3, respectively). Nestin, EpCAM, and Ran loading control and their corresponding molecular weight markers are labeled as indicated. B, at 24 hours after probe exposure, U251 human glioma cells (bottom) were counterstained with EpCAM and DAPI as labeled, alongside EpCAM-positive control PC3 human prostate cancer cells (top) to confirm lack of EpCAM expression in glioma via immunofluorescence. Right, merge image is shown. C, U251 (constitutively expressing GFP) human glioma cells were orthotopically implanted in a nude, athymic mouse with post-mortem brain harvesting and sectioning for H&E staining and immunofluorescence staining of markers (H&E, Nestin antibody, GFAP antibody, EpCAM antibody, hTERT antibody, DAPI antibody), alongside a negative control (normal mouse brain). D, Western blot analysis was used to detect hTERT expression in human glioma cancer cells (U251, U373, and U87), human breast cancer cells (SKBR3), and human prostate cancer cell lines (PC3), alongside negative control normal mouse brain extract. hTERT and β-actin loading control and their corresponding molecular weight markers are labeled as indicated.
Figure 2
Figure 2
Telomerase-based assay probe in vitro characterization for glioma tumor cell detection. A, human glioma cancer cells (U251, U373, and U87 as indicated) were infected with the probe at multiplicity of infection of 10, and (×20) images were obtained over 72 hours. Representative phase-contrast microscopy images (to depict morphology, bottom) and fluorescence microscopy images (to demonstrate GFP expression, bottom) are provided. B, at the respective indicated time points of the in vitro time-course experiment, automated computer software was used to determine quantity of cells transduced by the probe (demarcated by GFP expression) and total quantity of cells present on phase microscopy. Ratio of cells infected by the probe to maximal glioma cells present was calculated to establish the ideal time point for optimal specificity and sensitivity of tumor cell detection by the probe. C, U251 human glioma cells (constitutively expressing the red fluorescent mCherry protein) were spiked into control human blood followed by standard isolation and processing. Cancer cell–specific identification by the probe was demonstrated by the colocalization of mCherry (red) and GFP (green) fluorescence against a background of nontransduced WBCs (DAPI-positive, GFP-negative cells).
Figure 3
Figure 3
Clinical results: glioma CTC detection and verification. A, a peripheral blood clinical sample was obtained from a representative patient with glioma and subjected to standard processing and enrichment for CTCs with fluorescent microscopy images acquired 24 hours following addition of the probe. Secondary immunofluorescence staining was conducted for Nestin (red). Panels show representative imaging of a CTC identified with white arrows, indicating the colocalization of a CTC after probe (green) identification and Nestin (red) staining. DAPI was used to delineate the nuclei of all cells. B, a peripheral blood clinical sample was obtained from a patient with glioma (whose primary tumor was known to have amplification of the EGFR gene and overexpression of EGFR protein) and subjected to standard processing and enrichment for CTCs with fluorescent microscopy images acquired 24 hours following addition of probe. Secondary immunofluorescence staining was conducted for EGFR (red) as indicated. White arrows indicate the colocalization of two separate CTCs (top and bottom) identified after probe (green) identification and EGFR (red) staining. DAPI was used to identify the nuclei of cells.
Figure 4
Figure 4
Clinical results: serial enumeration to monitor treatment response in pilot study. A, peripheral blood clinical sample was obtained from preradiotherapy glioblastoma multiforme patient and subjected to standard processing and enrichment for CTCs with fluorescent microscopy images acquired following antibody (Nestin, DAPI) staining at 24 hours after exposure to the assay probe. T, classifier threshold, defined as the level observed in controls (healthy volunteers). B, CTC counts are elevated in most patients with glioma before the start of radiotherapy (Pre-RT), with marked overall decrease after treatment regimen completion (Post-RT). T, classifier threshold. C, comparison of CTC trends and brain axial MRI of "progressive disease" versus "pseudoprogression." MRI was performed within 2 weeks before initiation of radiotherapy (Pre-RT) and approximately 1 month following completion of treatment (Post-RT). CTC results (in CTC/mL) are included below axial MR images at the respective time points. Red arrows, left thalamic lesion before and following radiotherapy (left). Inset box delineated by the dotted red line (left, postradiotherapy) demonstrates the tumor area of interest and the associated advanced MRI rCBV map conducted in the postradiotherapy setting. Advanced MRI confirmed active tumor progression after analysis of rCBV fraction. Blue arrows, MR signal abnormality in midbrain lesion and surrounding area on axial view before and following radiotherapy (right).

References

    1. Imperato JP, Paleologos NA, Vick NA. Effects of treatment on long-term survivors with malignant astrocytomas. Ann Neurol. 1990;28:818–822. - PubMed
    1. Stupp R, Mason WP, van den Bent MJ, Weller M, Fisher B, Taphoorn MJ, et al. Radiotherapy plus concomitant and adjuvant temozolomide for glioblastoma. N Engl J Med. 2005;352:987–996. - PubMed
    1. Mehta AI, Kanaly CW, Friedman AH, Bigner DD, Sampson JH. Monitoring radiographic brain tumor progression. Toxins. 2011;3:191–200. - PMC - PubMed
    1. Baumann BC, Kao GD, Mahmud A, Harada T, Swift J, Chapman C, et al. Enhancing the efficacy of drug-loaded nanocarriers against brain tumors by targeted radiation therapy. Oncotarget. 2013;4:64–79. - PMC - PubMed
    1. Baumann BC, Dorsey JF, Benci JL, Joh DY, Kao GD. Stereotactic intracranial implantation and in vivo bioluminescent imaging of tumor xenografts in a mouse model system of glioblastoma multiforme. J Vis Exp. 2012;pii:4089. - PMC - PubMed

Publication types

MeSH terms