

IOP elevation reduces Schlemm's canal cross-sectional area
- PMID: 24526436
- PMCID: PMC3968930
- DOI: 10.1167/iovs.13-13264
IOP elevation reduces Schlemm's canal cross-sectional area
Abstract
Purpose: Previously, we demonstrated reduced Schlemm's canal cross-sectional area (SC-CSA) with increased perfusion pressure in a cadaveric flow model. The purpose of the present study was to determine the effect of acute IOP elevation on SC-CSA in living human eyes.
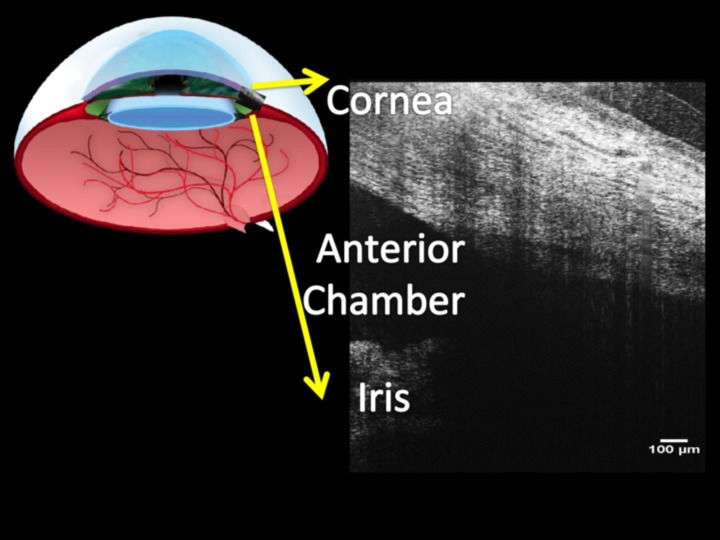
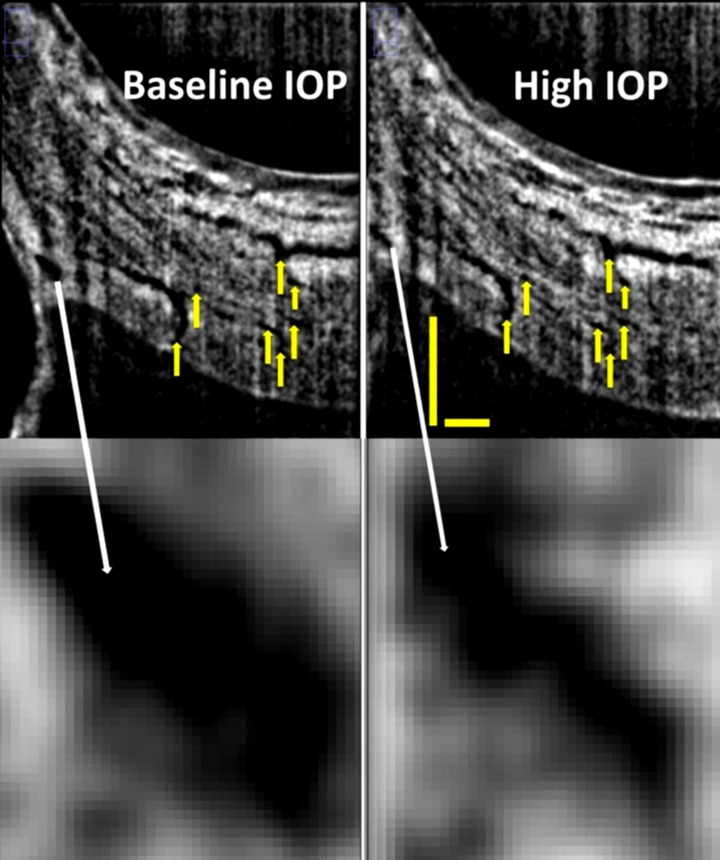
Methods: The temporal limbus of 27 eyes of 14 healthy subjects (10 male, 4 female, age 36 ± 13 years) was imaged by spectral-domain optical coherence tomography at baseline and with IOP elevation (ophthalmodynamometer set at 30-g force). Intraocular pressure was measured at baseline and with IOP elevation by Goldmann applanation tonometry. Vascular landmarks were used to identify corresponding locations in baseline and IOP elevation scan volumes. Schlemm's canal CSA at five locations within a 1-mm length of SC was measured in ImageJ as described previously. A linear mixed-effects model quantified the effect of IOP elevation on SC-CSA.
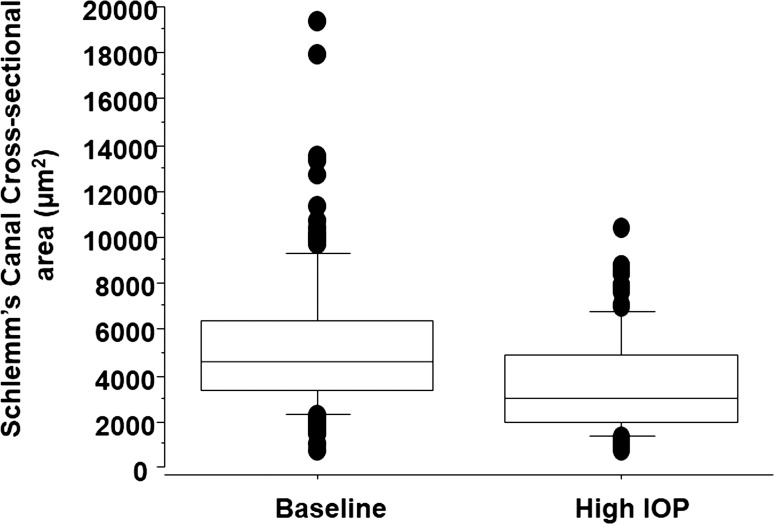
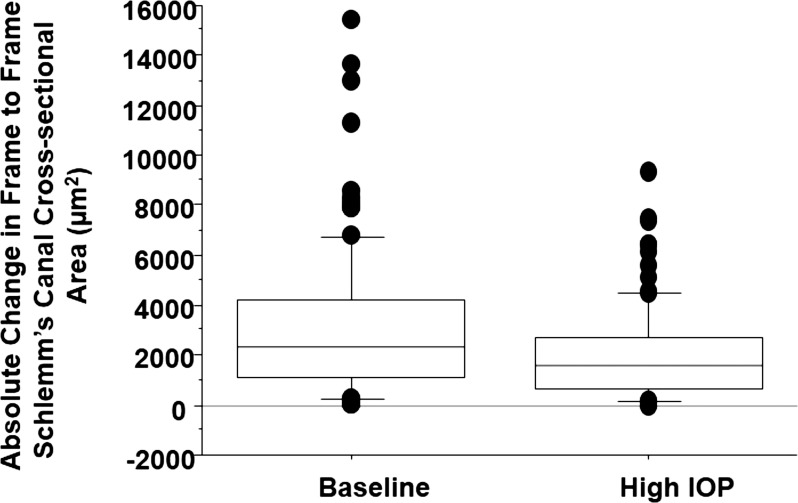
Results: The mean IOP increase was 189%, and the mean SC-CSA decrease was 32% (P < 0.001). The estimate (95% confidence interval) for SC-CSA response to IOP change was -66.6 (-80.6 to -52.7) μm(2)/mm Hg.
Conclusions: Acute IOP elevation significantly reduces SC-CSA in healthy eyes. Acute dynamic response to IOP elevation may be a useful future characterization of ocular health in the management of glaucoma.
Keywords: ophthalmodynamometer; optical coherence tomography; outflow tract imaging.
Figures
References
-
- Sommer A, Tielsch JM, Katz J, et al. Relationship between intraocular pressure and primary open angle glaucoma among white and black Americans. The Baltimore Eye Survey. Arch Ophthalmol. 1991; 109: 1090–1095 - PubMed
-
- Sommer A, Tielsch JM, Katz J, et al. Racial differences in the cause-specific prevalence of blindness in east Baltimore. N Engl J Med. 1991; 325: 1412–1417 - PubMed
-
- Leske MC, Connell AM, Wu SY, Hyman L, Schachat AP. Distribution of intraocular pressure. The Barbados Eye Study. Arch Ophthalmol. 1997; 115: 1051–1057 - PubMed
-
- Leske MC, Wu SY, Hennis A, Honkanen R, Nemesure B. Risk factors for incident open-angle glaucoma: the Barbados Eye Studies. Ophthalmology. 2008; 115: 85–93 - PubMed
Publication types
MeSH terms
Grants and funding
LinkOut - more resources
Full Text Sources
Other Literature Sources
Medical
