A structural and energetic model for the slow-onset inhibition of the Mycobacterium tuberculosis enoyl-ACP reductase InhA
- PMID: 24527857
- PMCID: PMC4004265
- DOI: 10.1021/cb400896g
A structural and energetic model for the slow-onset inhibition of the Mycobacterium tuberculosis enoyl-ACP reductase InhA
Abstract
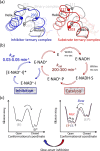
Slow-onset enzyme inhibitors are of great interest for drug discovery programs since the slow dissociation of the inhibitor from the drug-target complex results in sustained target occupancy leading to improved pharmacodynamics. However, the structural basis for slow-onset inhibition is often not fully understood, hindering the development of structure-kinetic relationships and the rational optimization of drug-target residence time. Previously we demonstrated that slow-onset inhibition of the Mycobacterium tuberculosis enoyl-ACP reductase InhA correlated with motions of a substrate-binding loop (SBL) near the active site. In the present work, X-ray crystallography and molecular dynamics simulations have been used to map the structural and energetic changes of the SBL that occur upon enzyme inhibition. Helix-6 within the SBL adopts an open conformation when the inhibitor structure or binding kinetics is substrate-like. In contrast, slow-onset inhibition results in large-scale local refolding in which helix-6 adopts a closed conformation not normally populated during substrate turnover. The open and closed conformations of helix-6 are hypothesized to represent the EI and EI* states on the two-step induced-fit reaction coordinate for enzyme inhibition. These two states were used as the end points for nudged elastic band molecular dynamics simulations resulting in two-dimensional potential energy profiles that reveal the barrier between EI and EI*, thus rationalizing the binding kinetics observed with different inhibitors. Our findings indicate that the structural basis for slow-onset kinetics can be understood once the structures of both EI and EI* have been identified, thus providing a starting point for the rational control of enzyme-inhibitor binding kinetics.
Figures


Similar articles
-
A slow, tight binding inhibitor of InhA, the enoyl-acyl carrier protein reductase from Mycobacterium tuberculosis.J Biol Chem. 2010 May 7;285(19):14330-7. doi: 10.1074/jbc.M109.090373. Epub 2010 Mar 3. J Biol Chem. 2010. PMID: 20200152 Free PMC article.
-
The isoniazid-NAD adduct is a slow, tight-binding inhibitor of InhA, the Mycobacterium tuberculosis enoyl reductase: adduct affinity and drug resistance.Proc Natl Acad Sci U S A. 2003 Nov 25;100(24):13881-6. doi: 10.1073/pnas.2235848100. Epub 2003 Nov 17. Proc Natl Acad Sci U S A. 2003. PMID: 14623976 Free PMC article.
-
Rational Modulation of the Induced-Fit Conformational Change for Slow-Onset Inhibition in Mycobacterium tuberculosis InhA.Biochemistry. 2015 Aug 4;54(30):4683-91. doi: 10.1021/acs.biochem.5b00284. Epub 2015 Jul 24. Biochemistry. 2015. PMID: 26147157 Free PMC article.
-
Recent Advances and Structural Features of Enoyl-ACP Reductase Inhibitors of Mycobacterium tuberculosis.Arch Pharm (Weinheim). 2016 Nov;349(11):817-826. doi: 10.1002/ardp.201600186. Epub 2016 Oct 24. Arch Pharm (Weinheim). 2016. PMID: 27775177 Review.
-
Slow-onset inhibition of 2-trans-enoyl-ACP (CoA) reductase from Mycobacterium tuberculosis by an inorganic complex.Curr Pharm Des. 2006;12(19):2409-24. doi: 10.2174/138161206777698927. Curr Pharm Des. 2006. PMID: 16842188 Review.
Cited by
-
Protein-ligand (un)binding kinetics as a new paradigm for drug discovery at the crossroad between experiments and modelling.Medchemcomm. 2017 Jan 30;8(3):534-550. doi: 10.1039/c6md00581k. eCollection 2017 Mar 1. Medchemcomm. 2017. PMID: 30108770 Free PMC article. Review.
-
Membrane-assisted tariquidar access and binding mechanisms of human ATP-binding cassette transporter P-glycoprotein.Front Mol Biosci. 2024 Mar 15;11:1364494. doi: 10.3389/fmolb.2024.1364494. eCollection 2024. Front Mol Biosci. 2024. PMID: 38560519 Free PMC article.
-
Selectivity of Pyridone- and Diphenyl Ether-Based Inhibitors for the Yersinia pestis FabV Enoyl-ACP Reductase.Biochemistry. 2016 May 31;55(21):2992-3006. doi: 10.1021/acs.biochem.5b01301. Epub 2016 May 17. Biochemistry. 2016. PMID: 27136302 Free PMC article.
-
Trifluoromethylcinnamanilide Michael Acceptors for Treatment of Resistant Bacterial Infections.Int J Mol Sci. 2022 Dec 1;23(23):15090. doi: 10.3390/ijms232315090. Int J Mol Sci. 2022. PMID: 36499415 Free PMC article.
-
Accelerated trypsin autolysis by affinity polymer templates.RSC Adv. 2020 Aug 4;10(48):28711-28719. doi: 10.1039/d0ra05827k. eCollection 2020 Aug 3. RSC Adv. 2020. PMID: 35520047 Free PMC article.
References
-
- Schloss J. V. (1988) Significance of slow-binding enzyme-inhibition and its relationship to reaction-intermediate analogs. Acc. Chem. Res. 21, 348–353.
-
- Morrison J. F.; Walsh C. T. (1988) The behavior and significance of slow-binding enzyme inhibitors. Adv. Enzymol. Relat. Areas Mol. Biol. 61, 201–301. - PubMed
-
- Copeland R. A.; Pompliano D. L.; Meek T. D. (2006) Drug-target residence time and its implications for lead optimization. Nat. Rev. Drug Discovery 5, 730–739. - PubMed
-
- Lu H.; England K.; am Ende C.; Truglio J. J.; Luckner S.; Reddy B. G.; Marlenee N. L.; Knudson S. E.; Knudson D. L.; Bowen R. A.; Kisker C.; Slayden R. A.; Tonge P. J. (2009) Slow-onset inhibition of the FabI enoyl reductase from Francisella tularensis: residence time and in vivo activity. ACS Chem. Biol. 4, 221–231. - PMC - PubMed
-
- Copeland R. A. (2011) Conformational adaptation in drug-target interactions and residence time. Future Med. Chem. 3, 1491–1501. - PubMed
Publication types
MeSH terms
Substances
Grants and funding
LinkOut - more resources
Full Text Sources
Other Literature Sources

