. 2014 Aug;17(8):1207-20.
doi: 10.1017/S1461145714000054. Epub 2014 Feb 17.

Effects of histone deacetylase inhibitors on amygdaloid histone acetylation and neuropeptide Y expression: a role in anxiety-like and alcohol-drinking behaviours

Affiliations

Effects of histone deacetylase inhibitors on amygdaloid histone acetylation and neuropeptide Y expression: a role in anxiety-like and alcohol-drinking behaviours

Amul J Sakharkar et al. Int J Neuropsychopharmacol. 2014 Aug.

Abstract

Recent studies have demonstrated the involvement of epigenetic mechanisms in psychiatric disorders, including alcoholism. Here, we investigated the effects of histone deacetylase (HDAC) inhibitor, trichostatin A (TSA) on amygdaloid HDAC-induced histone deacetylation and neuropeptide Y (NPY) expression and on anxiety-like and alcohol-drinking behaviours in alcohol-preferring (P) and -non-preferring (NP) rats. It was found that P rats displayed higher anxiety-like and alcohol-drinking behaviours, higher amygdaloid nuclear, but not cytosolic, HDAC activity, which was associated with increased HDAC2 protein levels and deficits in histone acetylation and NPY expression in the central (CeA) and medial nucleus of amygdala (MeA), as compared to NP rats. TSA treatment attenuated the anxiety-like and alcohol-drinking behaviours, with concomitant reductions in amygdaloid nuclear, but not cytosolic HDAC activity, and HDAC2, but not HDAC4, protein levels in the CeA and MeA of P rats, without effect in NP rats. TSA treatment also increased global histone acetylation (H3-K9 and H4-K8) and NPY expression in the CeA and MeA of P, but not in NP rats. Histone H3 acetylation within the NPY promoter was also innately lower in the amygdala of P rats compared with NP rats; which was normalized by TSA treatment. Voluntary ethanol intake in P, but not NP rats, produced anxiolytic effects and decreased the HDAC2 levels and increased histone acetylation in the CeA and MeA. These results suggest that higher HDAC2 expression-related deficits in histone acetylation may be involved in lower NPY expression in the amygdala of P rats, and operative in controlling anxiety-like and alcohol-drinking behaviours.


Figures

Fig. 1
Fig. 1
Bar diagrams showing the effects of TSA on the measures of anxiety-like behaviors in the light/dark box (LDB) exploration test (A) and elevated plus maze (EPM) test (B) in P and NP rats. Values are the mean ± SEM of 12-13 rats per group for LDB exploration test and 13 rats per group for the EPM test. * Significantly (p<0.01-0.001) different from other groups [ANOVA (F3, 46 = 56.6, p<0.001 for light and dark compartments of LDB; F3, 48 = 29.9, P<0.001 for EPM % open arm entries; F3, 48 = 21.6, p<0.001for EPM % time spent in open arms) followed by Tukey’s test]. C: Bar diagrams showing mean ethanol intake (7% first three days and 9% next four days) and effects of TSA treatment on the mean ethanol intake (9%) during last three days of two-bottle free choice paradigm of drinking in P and NP rats. Values are 6-7 rats per group and represented as g/kg/day. Analysis of ethanol intake by two-way ANOVA showed significant group and treatment interaction (group × treatment: F1, 22 = 359.1; p < 0.001) and revealed significant (*) group differences (p< 0.001; Tukey’s test). Regression analysis showing a positive correlation between last day of 9% ethanol intake with blood ethanol levels of P and NP rats (n=13, p<0.0001, r2=0.9672) treated with vehicle (D) and of P rats (n=14, p<0.0001, r2=0.9374) treated with vehicle or TSA (E).
Fig. 2
Fig. 2
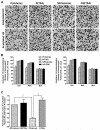
(A) Bar diagrams showing the effects of TSA on the HDAC activity [optical density (OD)/mg protein] in the nuclear and cytosolic fractions of the amygdala and cortex. Values are the mean ± SEM of 6 rats per group. *Significantly (p<0.01-0.001) different from other groups [ANOVA (F3, 20 = 10.4, p<0.001) followed by Tukey’s test). (B) Representative low-magnification photomicrographs of HDAC2 and HDAC4 gold-immunolabeling in central nucleus of amygdala (CeA) of P and NP rats treated with either vehicle [P (Vehicle) and NP (Vehicle)] or TSA [P(TSA) and NP(TSA)] (Scale bar = 50 μm). (C) Bar diagrams showing the changes in the protein levels of HDAC2 and HDAC4 in various amygdaloid (CeA, MeA, and BLA) structures of P and NP rats treated with either vehicle or TSA. Values are the mean ± SEM of 5 rats per group. *Significantly (p<0.001) different from other groups [ANOVA (HDAC2: CeA, F3, 16=340.7, p<0.001; MeA, F3, 16=256.8, p<0.001) followed by Tukey’s test]. (D) Representative photomicrographs showing immunofluorescence staining of HDAC2 (green) or NeuN (red), and GFAP (red) in the cells of the central nucleus of amygdala (CeA). The yellow color represents localization of HDAC2 in NeuN-positive and GFAP-positive cells. HDAC2 are predominantly expressed in NeuN-positive cells. Scale bar = 50 μm.
Fig. 3
Fig. 3
(A) Representative low-magnification photomicrographs of acetylated histones H3-K9 or H4-K8 gold-immunolabeling in central nucleus of amygdala (CeA) of P and NP rats treated with either vehicle [P (Vehicle) and NP(Vehicle)] or TSA [P(TSA) and NP(TSA)] (Scale bar = 50 μm). (B) Bar diagrams showing the changes in the acetylation levels of histones H3-K9 and H4-K8 in various amygdaloid (CeA, MeA, and BLA) structures of P and NP rats treated with either vehicle or TSA. Values are the mean ± SEM of 6 rats per group. *Significantly (p<0.001) different from other groups [ANOVA (acetylated H3-K9: CeA, F3, 20 = 84.1, p<0.001; MeA, F3, 20= 48.3, p<0.001 and acetylated H4-K8: CeA, F3, 20 = 40.7, p<0.001; MeA, F3, 20 = 55.9, p<0.001) followed by Tukey’s test]. (C) Bar diagram showing the fold changes in the histone acetylation (H3-K9/14) at the promoter of the NPY gene in the amygdala of P and NP rats as measured by the chromatin immunoprecipitation assay followed by quantitative PCR. Values are the mean ± SEM of 7 rats per group. *Significantly (p<0.001) different from other group [ANOVA (F3, 24 = 16.1, p<0.001) followed by Tukey’s test].
Fig. 4
Fig. 4
(A) Representative low-magnification photomicrographs of neuropeptide Y (NPY) in situ PCR and gold-immunolabeling in central nucleus of amygdala (CeA) of P and NP rats treated with either vehicle [P(Vehicle) and NP(Vehicle)] or TSA [P(TSA) and NP(TSA)] (Scale bar = 50 μm). (B) Bar diagrams showing the changes in the NPY mRNA and protein levels in various amygdaloid (CeA, MeA, and BLA) structures of P and NP rats treated with either vehicle or TSA. Values are the mean ± SEM of 6 rats per group. *Significantly (p<0.001) different from other groups [ANOVA (NPY mRNA: CeA, F3, 20 = 40.3, p<0.001; MeA, F3, 20= 46.3, p<0.001 and NPY protein: CeA, F3, 20 = 162.5, p<0.001; MeA, F3, 20 = 167.5, p<0.001) followed by Tukey’s test].
Fig. 5
Fig. 5
(A) Bar diagram showing the effect of voluntary ethanol drinking (without withdrawal) on the anxiety-like behaviors of the P and NP rats, as measured by the light dark box exploration test in terms of percent time spent in the light and dark compartments. Values are the mean ± SEM of 7-9 rats per group. *Significantly (p<0.001) different from other groups [ANOVA (F3, 28 = 82.5, p<0.001) followed by Tukey’s test)]. (B) Bar diagrams showing the changes in the levels of HDAC2 protein, and acetylated histones H3-K9 and H4-K8 in the amygdaloid (CeA, MeA, and BLA) structures of P and NP rats were allowed to drink ethanol for 10 days in two-bottle free choice paradigm [P(W/E) and NP(W/E)]. Controls concomitantly received the water in both the bottles [P (W/W) and NP (W/W)] of two-bottle free choice paradigm. Values are the mean ± SEM of 6-7 rats per group. *Significantly (p<0.05-0.001) different from other groups [ANOVA (HDAC2: CeA, F3, 22 = 21.2, p<0.001; MeA, F3, 22= 24.5, p<0.001; acetylated H3-K9: CeA, F3, 22 = 35.7, p<0.001; MeA, F3, 22= 8.8, p<0.001 and acetylated H4-K8: CeA, F3, 20 = 92.9, p<0.001; MeA, F3, 20 = 40.6, p<0.001) followed by Tukey’s test].

Similar articles

Cited by

References

    1. Abel T, Zukin RS. Epigenetic targets of HDAC inhibition in neurodegenerative and psychiatric disorders. Curr Opin Pharmacol. 2008;8:57–64. - PMC - PubMed
    1. Arora DS, Nimitvilai S, Teppen TL, McElvain MA, Sakharkar AJ, You C, Pandey SC, Brodie MS. Hyposensitivity to gamma-aminobutyric acid in the ventral tegmental area during alcohol withdrawal: reversal by histone deacetylase inhibitors. Neuropsychopharmacol. 2013;38:1674–1684. - PMC - PubMed
    1. Badia-Elder NE, Stewart RB, Powrozek TA, Roy KF, Murphy JM, Li T-K. Effect of neuropeptide Y (NPY) on oral ethanol intake in Wistar, alcohol-preferring (P), and -non preferring (NP) rats. Alcohol Clin Exp Res. 2001;25:386–390. - PubMed
    1. Bell RL, Rodd ZA, Lumeng L, Murphy JM, McBride WJ. The alcohol-preferring P rat and animal models of excessive alcohol drinking. Addict Biol. 2006;11:270–288. - PubMed
    1. Broide RS, Redwine JM, Aftahi N, Young W, Bloom FE, Winrow CJ. Distribution of histone deacetylases 1-11 in the rat brain. J Mol Neurosci. 2007;31:47–58. - PubMed

Publication types

MeSH terms