

Autophagy-lysosome pathway associated neuropathology and axonal degeneration in the brains of alpha-galactosidase A-deficient mice
- PMID: 24529306
- PMCID: PMC3933238
- DOI: 10.1186/2051-5960-2-20
Autophagy-lysosome pathway associated neuropathology and axonal degeneration in the brains of alpha-galactosidase A-deficient mice
Abstract
Background: Mutations in the gene for alpha-galactosidase A result in Fabry disease, a rare, X-linked lysosomal storage disorder characterized by a loss of alpha-galactosidase A enzymatic activity. The resultant accumulation of glycosphingolipids throughout the body leads to widespread vasculopathy with particular detriment to the kidneys, heart and nervous system. Disruption in the autophagy-lysosome pathway has been documented previously in Fabry disease but its relative contribution to nervous system pathology in Fabry disease is unknown. Using an experimental mouse model of Fabry disease, alpha-galactosidase A deficiency, we examined brain pathology in 20-24 month old mice with particular emphasis on the autophagy-lysosome pathway.
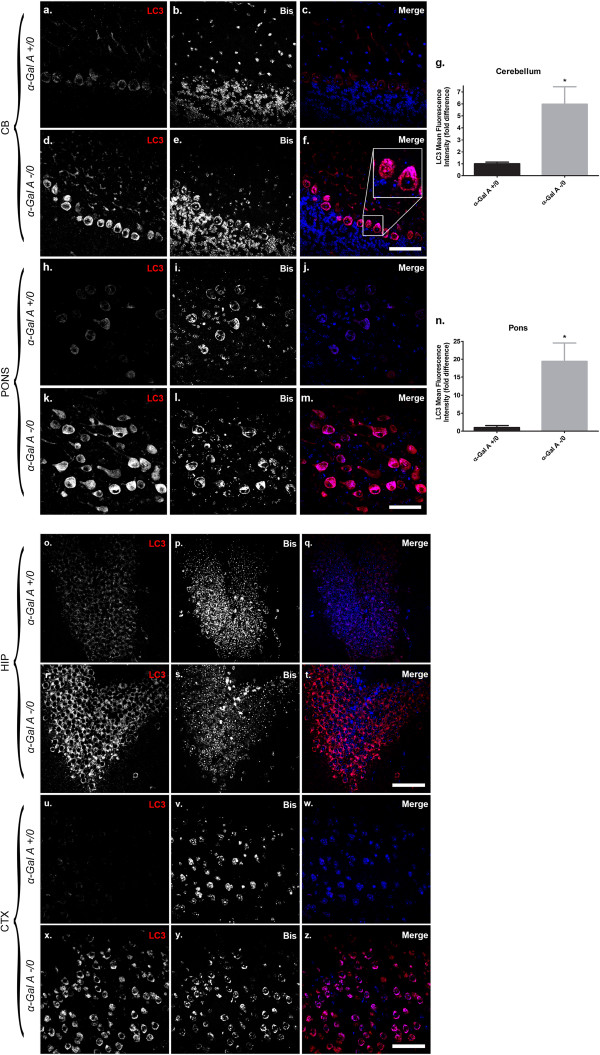
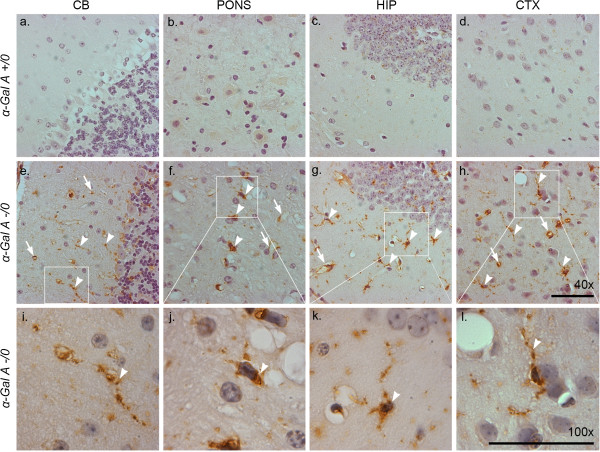
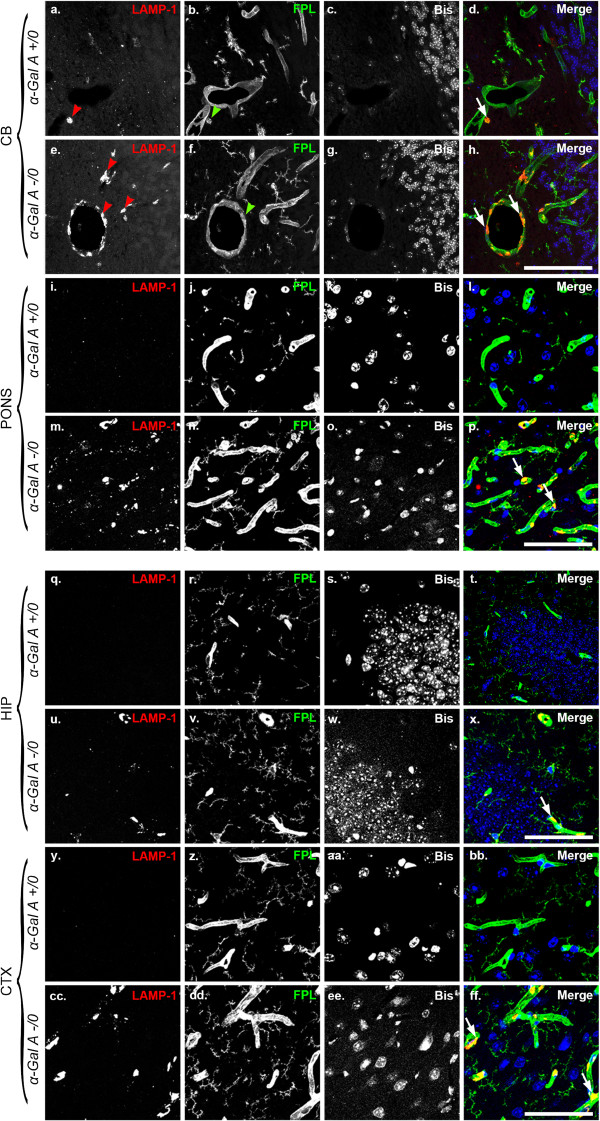
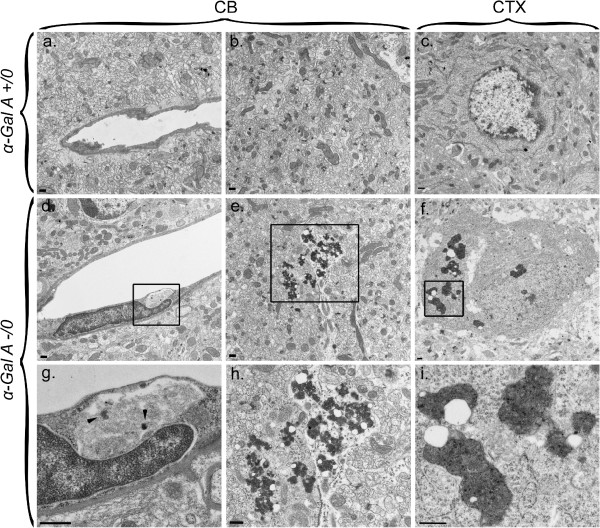
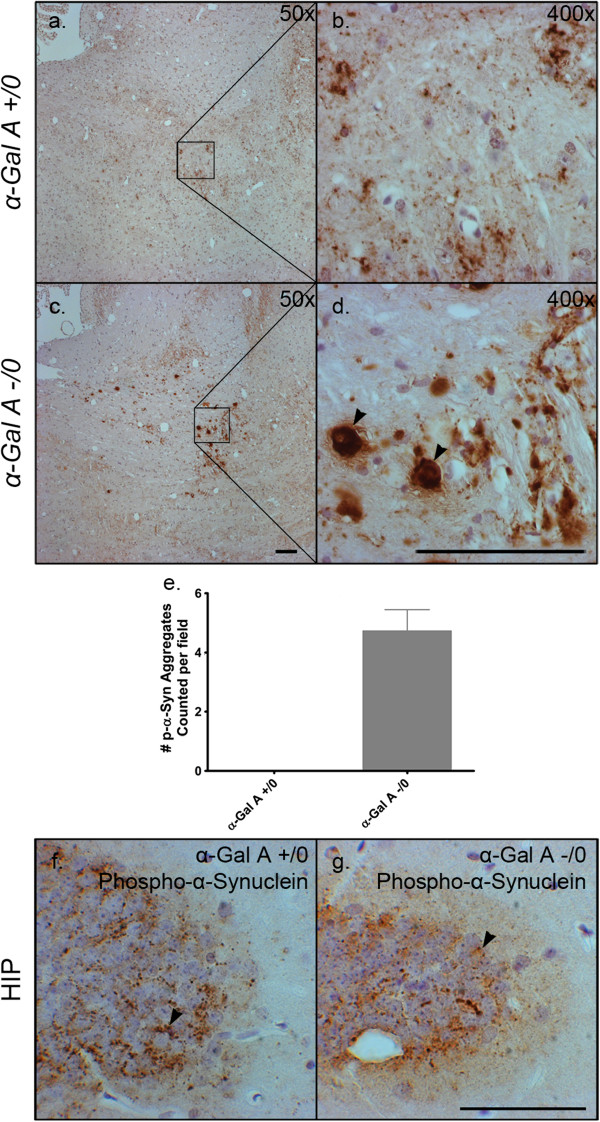
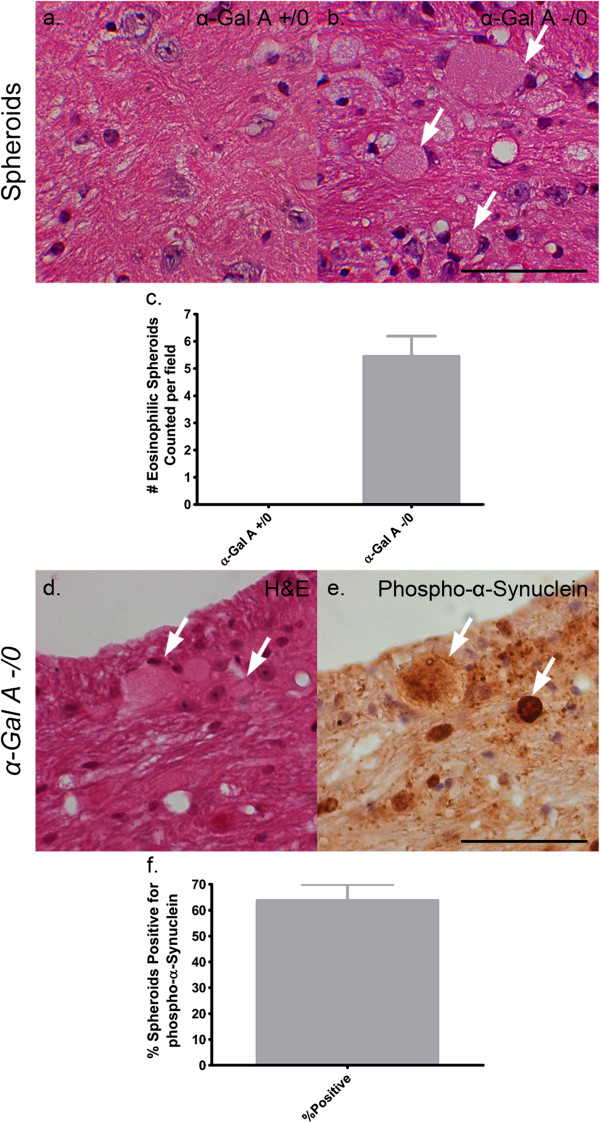
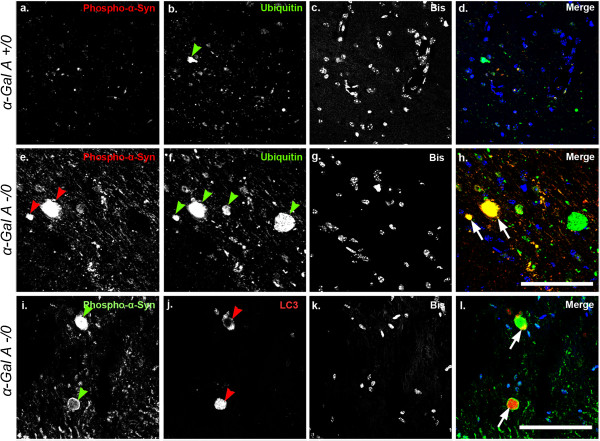
Results: Alpha-galactosidase A-deficient mouse brains exhibited enhanced punctate perinuclear immunoreactivity for the autophagy marker microtubule-associated protein light-chain 3 (LC3) in the parenchyma of several brain regions, as well as enhanced parenchymal and vascular immunoreactivity for lysosome-associated membrane protein-1 (LAMP-1). Ultrastructural analysis revealed endothelial cell inclusions with electron densities and a pronounced accumulation of electron-dense lipopigment. The pons of alpha-galactosidase A-deficient mice in particular exhibited a striking neuropathological phenotype, including the presence of large, swollen axonal spheroids indicating axonal degeneration, in addition to large interstitial aggregates positive for phosphorylated alpha-synuclein that co-localized with the axonal spheroids. Double-label immunofluorescence revealed co-localization of phosphorylated alpha-synuclein aggregates with ubiquitin and LC3.
Conclusion: Together these findings indicate widespread neuropathology and focused axonal neurodegeneration in alpha-galactosidase A-deficient mouse brain in association with disruption of the autophagy-lysosome pathway, and provide the basis for future mechanistic assessment of the contribution of the autophagy-lysosome pathway to this histologic phenotype.
Figures
Similar articles
-
Disrupted autophagy leads to dopaminergic axon and dendrite degeneration and promotes presynaptic accumulation of α-synuclein and LRRK2 in the brain.J Neurosci. 2012 May 30;32(22):7585-93. doi: 10.1523/JNEUROSCI.5809-11.2012. J Neurosci. 2012. PMID: 22649237 Free PMC article.
-
Autophagy-lysosome pathway alteration in ocular surface manifestations in Fabry disease patients.Orphanet J Rare Dis. 2022 Jul 23;17(1):291. doi: 10.1186/s13023-022-02441-3. Orphanet J Rare Dis. 2022. PMID: 35870972 Free PMC article.
-
Cathepsin D deficiency induces persistent neurodegeneration in the absence of Bax-dependent apoptosis.J Neurosci. 2007 Feb 21;27(8):2081-90. doi: 10.1523/JNEUROSCI.5577-06.2007. J Neurosci. 2007. PMID: 17314303 Free PMC article.
-
Autophagy and Alpha-Synuclein: Relevance to Parkinson's Disease and Related Synucleopathies.Mov Disord. 2016 Feb;31(2):178-92. doi: 10.1002/mds.26477. Epub 2016 Jan 27. Mov Disord. 2016. PMID: 26813776 Review.
-
Dysfunction of two lysosome degradation pathways of α-synuclein in Parkinson's disease: potential therapeutic targets?Neurosci Bull. 2012 Oct;28(5):649-57. doi: 10.1007/s12264-012-1263-1. Epub 2012 Sep 8. Neurosci Bull. 2012. PMID: 22961477 Free PMC article. Review.
Cited by
-
Secondary Mitochondrial Dysfunction as a Cause of Neurodegenerative Dysfunction in Lysosomal Storage Diseases and an Overview of Potential Therapies.Int J Mol Sci. 2022 Sep 12;23(18):10573. doi: 10.3390/ijms231810573. Int J Mol Sci. 2022. PMID: 36142486 Free PMC article. Review.
-
Glucocerebrosidase Defects as a Major Risk Factor for Parkinson's Disease.Front Aging Neurosci. 2020 Apr 21;12:97. doi: 10.3389/fnagi.2020.00097. eCollection 2020. Front Aging Neurosci. 2020. PMID: 32372943 Free PMC article. Review.
-
Parkinson's disease prevalence in Fabry disease: A survey study.Mol Genet Metab Rep. 2017 Nov 9;14:27-30. doi: 10.1016/j.ymgmr.2017.10.013. eCollection 2018 Mar. Mol Genet Metab Rep. 2017. PMID: 29159076 Free PMC article.
-
Lipophagy and Lipolysis Status in Lipid Storage and Lipid Metabolism Diseases.Int J Mol Sci. 2020 Aug 25;21(17):6113. doi: 10.3390/ijms21176113. Int J Mol Sci. 2020. PMID: 32854299 Free PMC article. Review.
-
Fabry disease exacerbates renal interstitial fibrosis after unilateral ureteral obstruction via impaired autophagy and enhanced apoptosis.Kidney Res Clin Pract. 2021 Jun;40(2):208-219. doi: 10.23876/j.krcp.20.264. Epub 2021 May 21. Kidney Res Clin Pract. 2021. PMID: 34024086 Free PMC article.
References
-
- Mehta A, Beck M, Sunder-Plassmann G. Fabry disease: perspectives from 5 years of FOS. Oxford, England: Oxford PharmaGenesis; 2006. - PubMed
Publication types
MeSH terms
Substances
Grants and funding
LinkOut - more resources
Full Text Sources
Other Literature Sources
Molecular Biology Databases
Research Materials
Miscellaneous
