. 2014 Feb 20;40(2):289-302.
doi: 10.1016/j.immuni.2014.01.005. Epub 2014 Feb 13.

Molecular and transcriptional basis of CD4⁺ T cell dysfunction during chronic infection

Affiliations

Molecular and transcriptional basis of CD4⁺ T cell dysfunction during chronic infection

Alison Crawford et al. Immunity. .

Abstract

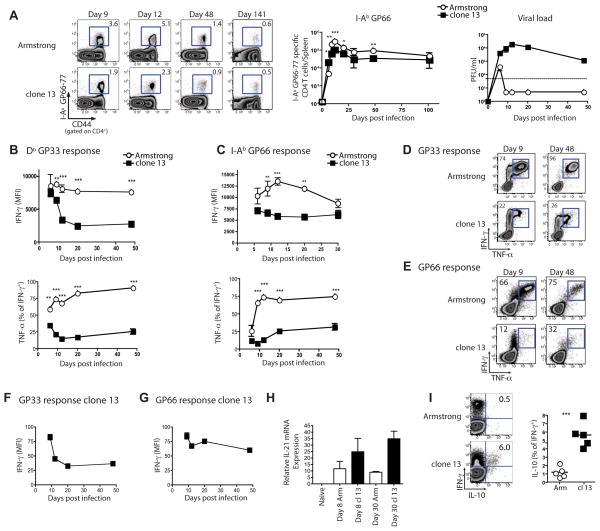
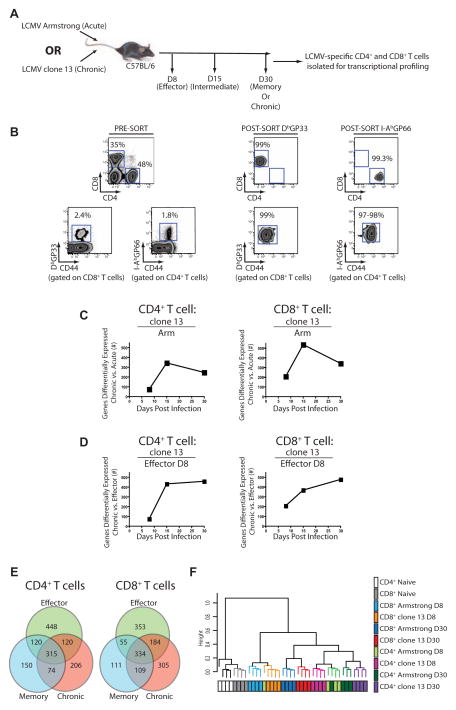
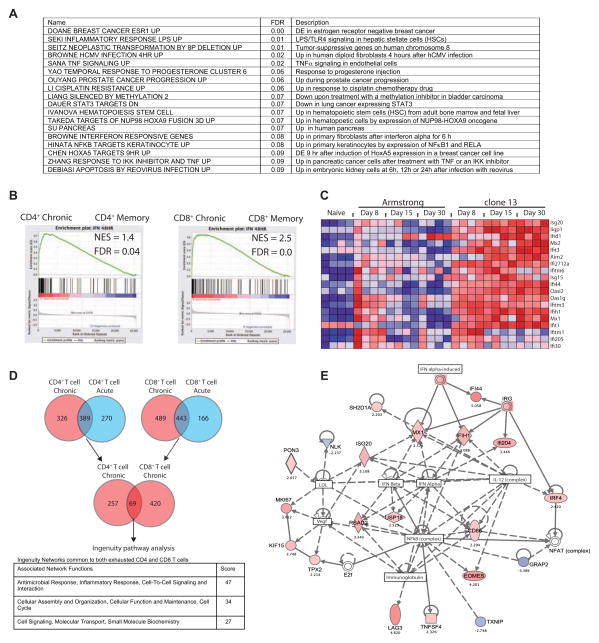
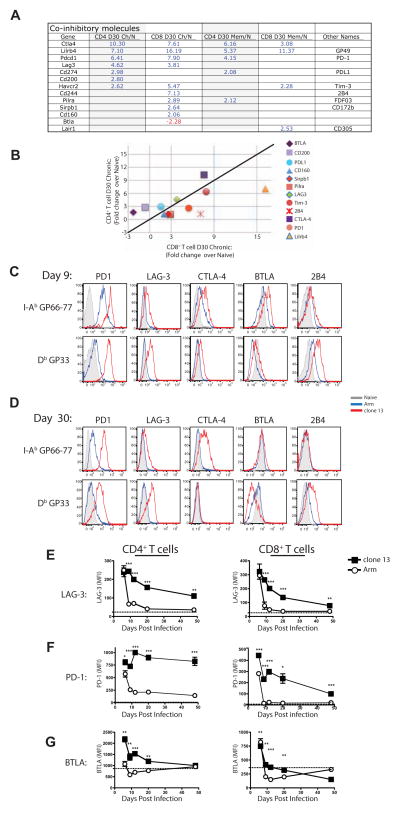
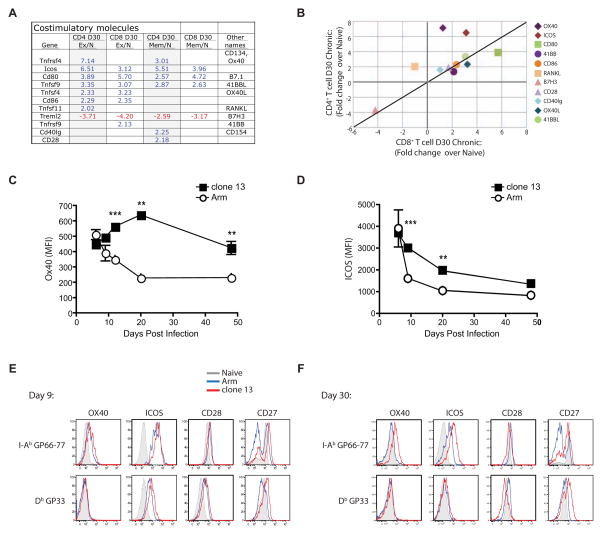
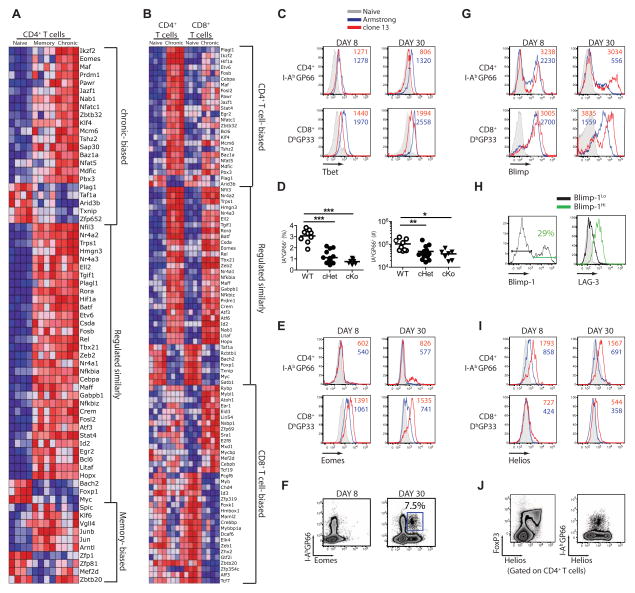
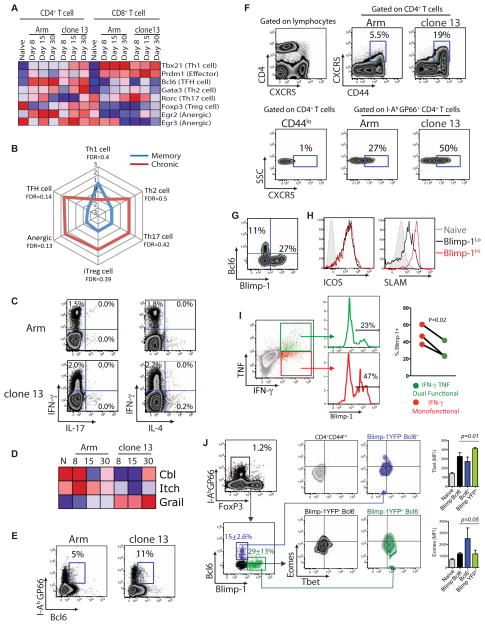
T cell exhaustion is common during chronic infections. Although CD4(+) T cells are critical for controlling viral load during chronic viral infections, less is known about their differentiation and transcriptional program. We defined the phenotypic, functional, and molecular profiles of exhausted CD4(+) T cells. Global transcriptional analysis demonstrated a molecular profile distinct from effector and memory CD4(+) T cells and also from exhausted CD8(+) T cells, though some common features of CD4(+) and CD8(+) T cell exhaustion were revealed. We have demonstrated unappreciated roles for transcription factors (TFs) including Helios, type I interferon (IFN-I) signaling, and a diverse set of coinhibitory and costimulatory molecules during CD4(+) T cell exhaustion. Moreover, the signature of CD4(+) T cell exhaustion was found to be distinct from that of other CD4(+) T cell lineage subsets and was associated with TF heterogeneity. This study provides a framework for therapeutic interventions targeting exhausted CD4(+) T cells.


Figures

Figure 1
Figure 1. Kinetics of cytokine production by virus-specific CD4+ and CD8+ T cells during chronic LCMV infection
(A) Representative flow plots of I-AbGP66 tetramer staining on the indicated days p.i. with Arm or clone 13. Numbers show percent of CD4+ T cells specific for GP66. Total number of I-AbGP66 tetramer+ CD4+ T cells in spleen during acute (open symbols) or chronic (closed symbols) LCMV infection (middle). Viral load in the serum over time p.i. with either Arm (open symbols) or clone 13 (filled symbols) (right). (B) MFI of IFN-γ in response to GP33 stimulation (top) and the percentage of IFN-γ producing cells co-producing TNF-α (bottom). (C) CD4+ T cell responses to GP66-77 as described in (B). (D and E) Representative flow plots are shown for cytokine co-production in response to GP33 (D) or GP66 peptide (E). (F and G) MFI of IFN-γ as a percentage of d6 IFN-γ MFI for CD8 (F) and CD4+ T cells (G). (H) IL-21 mRNA expression on d8 and 30 p.i. with Arm or clone 13 in sorted I-AbGP66 tetramer+ CD4+ T cells. (I) Representative plots of IFN-γ and IL-10 production by GP66-specific CD4+ T cells on d30 p.i. and summary of the percent of IFNγ-producers making IL-10. Data are representative over at least 3 independent experiments with 2–4 mice/group. Error bars indicated standard deviation. Figure 1, see also Figure S1.
Figure 2
Figure 2. Transcriptional profiling of LCMV-specific CD4+ and CD8+ T cells from mice infected with Arm or clone 13
(A) Schematic of the experimental design. (B) Pre- and post-sort purities for DbGP33-specific CD8+ T cells and I-AbGP66-specific CD4+ T cells. (C) The number of differentially expressed genes for CD4+ (left) and CD8+ T cells (right) from clone 13 compared to Arm at each time p.i. (D) The total number of differentially expressed genes from virus-specific CD4+ or CD8+ T cells from clone 13 infected mice on d8, 15, and 30 p.i. compared to d8 effector T cells from Arm. (E) Differentially expressed genes between d8 effector T cells from Arm infected mice, memory T cells from d30 p.i. with Arm and exhausted T cells isolated from d30 p.i. with clone 13. (F) Hierarchical clustering of CD4+ and CD8+ T cell responses to acute and chronic infections. Genes differentially expressed by a covariance of 0.1 were analyzed using Spearman’s correlation. Microarray data are representative of 4 independent samples per time point. Figure 2, see also Figure S2 and Table S1.
Figure 3
Figure 3. Biological pathways enriched in exhausted CD4+ T cells
(A) Enriched gene sets in exhausted versus effector or memory CD4+ T cells using GSEA analysis and the MSigDB C2 curated gene sets. (B) GSEA of exhausted versus memory CD4+ or CD8+ T cells with an IFN-I transcriptional signature (Agarwal et al., 2009). (C) Heatmap of IFN responsive genes differentially expressed by exhausted CD4+ T cells (over naïve). (D) The core exhausted signature shared in CD4+ and CD8+ T cells (see also Table S3). Networks identified and their score from Ingenuity pathway analysis are shown. (E) Ingenuity pathway analysis of the main network associated with both exhausted CD4+ and CD8+ T cells. Figure 3, see also Figure S3 and Table S2 and S3.
Figure 4
Figure 4. Inhibitory receptor expression by exhausted CD4+ and CD8+ T cells
(A) Genes encoding coinhibitory receptors differentially expressed by memory and exhausted virus-specific T cells. (B) Fold change in expression of coinhibitory receptors by exhausted T cells at d30 p.i. compared to naïve T cells. (C and D) Representative histograms showing expression of coinhibitory receptors (PD-1, LAG-3, CTLA-4, BTLA, and 2B4) on LCMV-specific CD4+ and CD8+ T cells on d9 (C) or d30 (D). Histograms depict naïve T cells (CD44Lo; grey) or virus-specific T cells from Arm (blue) or clone 13 (red) infection. (E, F and G) MFI of LAG-3 (E), PD-1 (F) and BTLA (G) expression by LCMV-specific CD4+ (left) or CD8+ (right) T cells. Data are representative of 3–8 independent experiments with at least 3 mice per group at each time point. Error bars represent standard deviation. Figure 4, see also Figure S4 and Table S2.
Figure 5
Figure 5. Costimulatory molecule expression by T cells during Arm versus clone 13 infection
(A) Genes encoding costimulatory molecules differentially expressed in LCMV-specific CD4+ and CD8+ T cells at d30 p.i. (B) Fold changes over naïve for exhausted CD4+ and CD8+ T cells at d30 p.i. (C and D) MFI of OX40 (C) and ICOS (D) by I-AbGP66-specific CD4+ T cells over time. (E and F) Representative histograms showing expression of ICOS, OX40, CD28 and CD27 at d9 (E) and d30 (F) p.i. Histograms depict naïve T cells (CD44Lo; grey) or virus-specific T cells from Arm (blue) or clone 13 (red) infection. Data are representative of 4–7 independent experiments with at least 3 mice per group at each time point. Error bars represent standard deviation. Figure 5, see also Figure S4 and Table S2
Figure 6
Figure 6. TF profile of memory and exhausted CD4+ and CD8+ T cells
(A) Heatmap of TFs differentially expressed by either memory or exhausted virus-specific CD4+ T cells. (B) Heatmap of TFs differentially expressed by exhausted virus-specific CD4+ or CD8+ T cells. (C) Histograms show protein expression of T-bet by LCMV-specific CD4+ and CD8+ T cells with Arm (blue), clone 13 (red) infection, or in CD4+CD44lo cells (grey). (D) I-AbGP66-specific CD4+ T cell frequency (left) and total numbers per spleen (right) in WT, Tbx21flox/+XCd4creor Tbx21flox/floxXCd4cre mice at d30 p.i. with LCMV clone 13. (E) Eomes expression by LCMV-specific CD4+ and CD8+ T cells from Arm (blue), clone 13 (red) infection, or CD4+CD44lo cells (grey). Numbers show MFI in cells from clone 13 (red) or Armstrong-infected mice (blue). (F) Representative flow plots for Eomes expression on d8 and d30 p.i. with clone 13. Number shows the percent of I-AbGP66+ CD4+ T cells expressing Eomes. (G) Representative histograms of YFP expression by LCMV-specific CD4+ T cells and CD8+ T cells from Blimp-1-YFP reporter mice at d8 and d30 p.i. with LCMV clone 13. Numbers show the MFI of YFP expression in cells from clone 13 (red) or Armstrong-infected mice (blue). (H) At d30 p.i. with clone 13, IAbGP66-specific CD4+ T cells from Blimp-1-YFP mice were gated on Blimp-1Hi or Blimp-1Lo and examined for LAG-3 expression. Number shows the percent of I-AbGP66+ CD4+ T cells expressing Blimp-1. (I) Helios expression by LCMV-specific CD4+ or CD8+ T cells. Gated on I-AbGP66+ CD4+ T cells from Arm (Red) or clone 13 (blue) infection. (J) Representative flow plots of Helios versus FoxP3 or I-AbGP66 tetramer for CD4+ T cells at d30 p.i. with clone 13. Data are representative of 2–4 independent experiments with at least 3 mice per group at each time point. Figure 6, see also Figure S5.
Figure 7
Figure 7. T helper cell lineage differentiation during clone 13 infection
(A) Heatmap of expression of TFs associated with distinct T helper cell lineages in LCMV-specific CD4+ and CD8+ T cells. (B) GSEA of exhausted versus memory CD4+ T cells with signatures from the specified Th cell subsets. Normalized enrichment scores (NES) are plotted. Red = clone 13. Blue = Arm. Using an FDR score of 0.01 there was no significant enrichment of any subset for exhausted CD4+ T cells. (C) Representative flow plots show IL-4 or IL-17 production following peptide stimulation and ICS (gated on CD4+ T cells). Numbers show the percent of CD4+ T cells expressing cytokines. (D) Heatmap of Cbl, Itch and Grail expression by LCMV-specific CD4+ T cells. (E) Representative flow plots of Bcl6 expression by CD4+ T cells at d30 p.i. with Arm or clone 13. Numbers show the percent of I-AbGP66+ CD4+ T cells expressing Bcl6. (F) CXCR5 expression by total and IAbGP66+ CD4+ T cells. Numbers show the percentage of cells expressing CXCR5. (G) Representative plots of Blimp-1-YFP versus Bcl6 expression in I-AbGP66+ CD4+ T cells at d30 p.i. with clone 13. (H) LCMV-specific CD4+ T cells from Blimp-1-YFP mice were examined for expression of ICOS and SLAM at d30 p.i. with clone 13. I-AbGP66+ CD4+ T cells were gated for low or high Blimp-1 expression then examined for ICOS or SLAM expression. (I) Blimp-1-YFP mice were infected with LCMV clone 13 and on d30 p.i. ICS was performed with GP66 peptide stimulation followed by staining for IFN-γ and TNF. Dual functional (IFN-γ+TNF+) and monofunctional (IFN-γ+ only) virus-specific CD4+ T cells were then examined for Blimp-1-YFP expression. P-value determined using a paired T-test. (J) Representative flow plots of TF expression in I-AbGP66+ CD4+ T cells at d30 post infection with LCMV clone 13. Foxp3- I-AbGP66+ CD4+ T cells were separated into 3 distinct populations (Blimp-1+Bcl6, Blimp-1Bcl6, Blimp-1+Bcl6+) then examined for expression of Eomes and Tbet. Numbers represent the percentage of cells expressing the marker with standard deviation. Statistical relevance was determined using two-way ANOVA. Data are representative of 2–5 independent experiments with at least 3 mice per group at each time point. Error bars represent standard deviation. Figure 7, see also Figure S6.

Similar articles

Cited by

References

    1. Agarwal P, Raghavan A, Nandiwada SL, Curtsinger JM, Bohjanen PR, Mueller DL, Mescher MF. Gene regulation and chromatin remodeling by IL-12 and type I IFN in programming for CD8 T cell effector function and memory. J Immunol. 2009;183:1695–1704. - PMC - PubMed
    1. Agnellini P, Wolint P, Rehr M, Cahenzli J, Karrer U, Oxenius A. Impaired NFAT nuclear translocation results in split exhaustion of virus-specific CD8+ T cell functions during chronic viral infection. Proc Natl Acad Sci U S A. 2007;104:4565–4570. - PMC - PubMed
    1. Ahmed R, Salmi A, Butler LD, Chiller JM, Oldstone MB. Selection of genetic variants of lymphocytic choriomeningitis virus in spleens of persistently infected mice. Role in suppression of cytotoxic T lymphocyte response and viral persistence. J Exp Med. 1984;160:521–540. - PMC - PubMed
    1. Bartosch B, Bukh J, Meunier JC, Granier C, Engle RE, Blackwelder WC, Emerson SU, Cosset FL, Purcell RH. In vitro assay for neutralizing antibody to hepatitis C virus: evidence for broadly conserved neutralization epitopes. Proc Natl Acad Sci U S A. 2003;100:14199–14204. - PMC - PubMed
    1. Berry MP, Graham CM, McNab FW, Xu Z, Bloch SA, Oni T, Wilkinson KA, Banchereau R, Skinner J, Wilkinson RJ, et al. An interferon-inducible neutrophil-driven blood transcriptional signature in human tuberculosis. Nature. 2010;466:973–977. - PMC - PubMed

Publication types

MeSH terms

Associated data