. 2014 Apr;40(4):714-26.
doi: 10.1016/j.ultrasmedbio.2013.11.029. Epub 2014 Feb 14.

Reverberation clutter from subcutaneous tissue layers: simulation and in vivo demonstrations

Affiliations

Reverberation clutter from subcutaneous tissue layers: simulation and in vivo demonstrations

Jeremy J Dahl et al. Ultrasound Med Biol. 2014 Apr.

Abstract

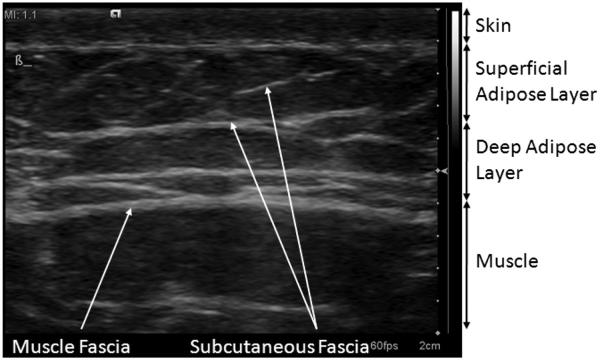
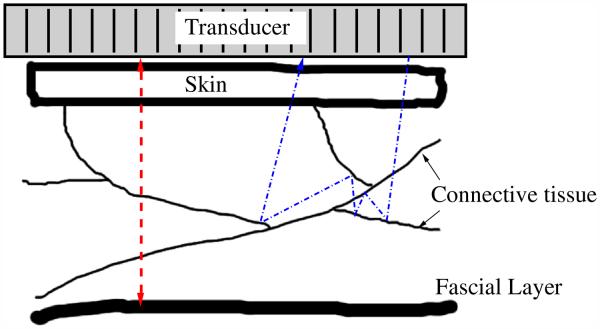
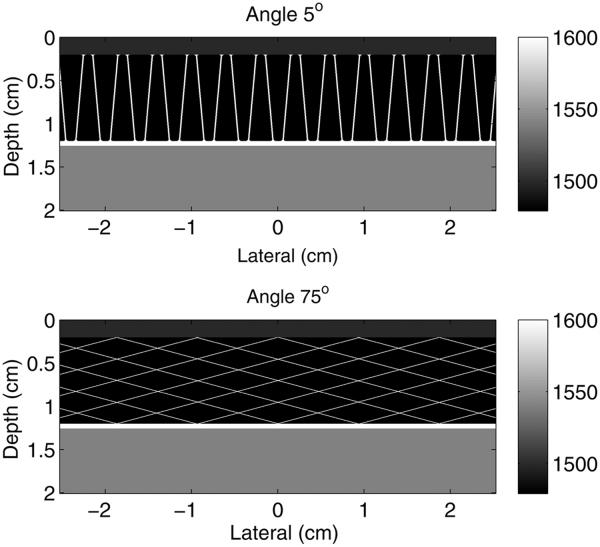
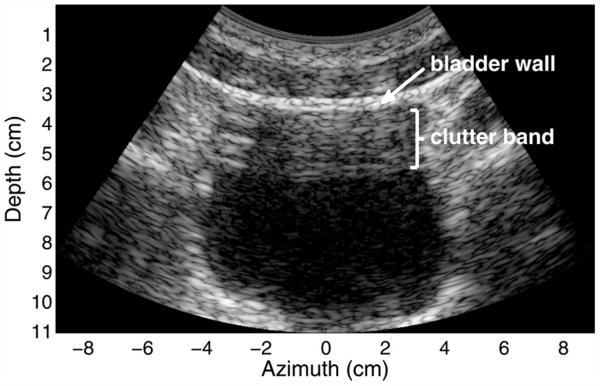
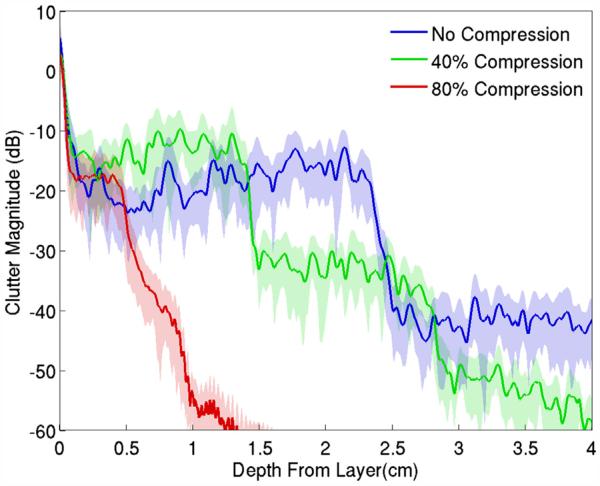
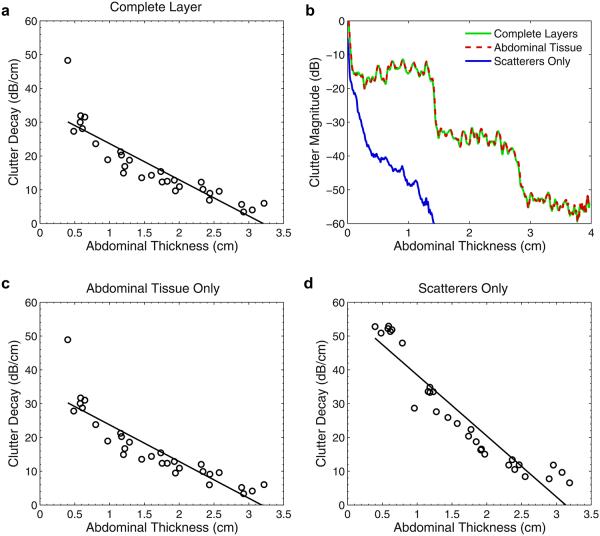
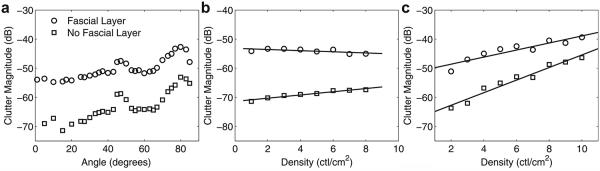
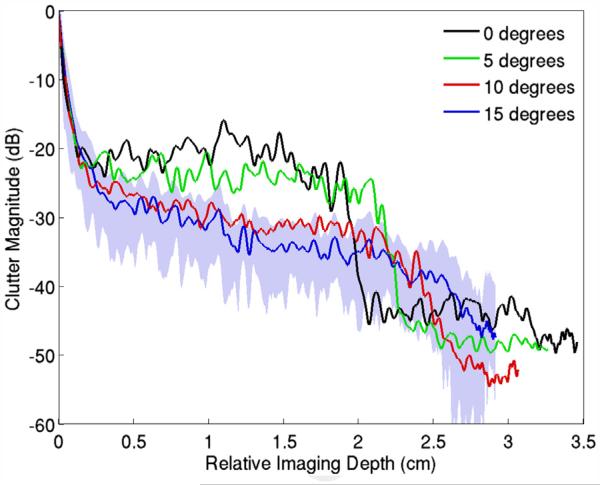
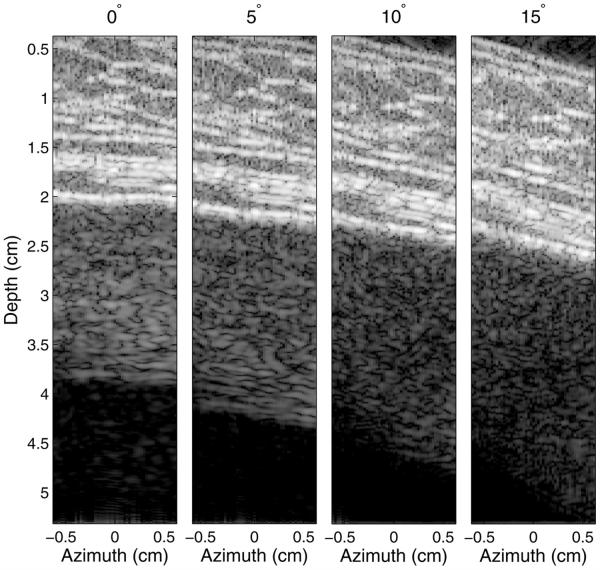
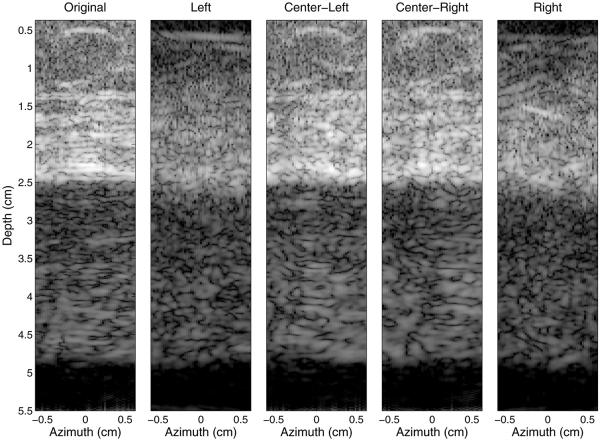
The degradation of ultrasonic image quality is typically attributed to aberration and reverberation. Although the sources and impact of aberration are well understood, very little is known about the source and impact of image degradation caused by reverberation. Reverberation is typically associated with multiple reflections at two interfaces along the same propagation path, as with the arterial wall or a metal sphere. However, the reverberation that results in image degradation includes more complex interaction between the propagating wave and the tissue. Simulations of wave propagation in realistic and simplified models of the abdominal wall are used to illustrate the characteristics of coherent and diffuse clutter generated by reverberation. In the realistic models, diffuse reverberation clutter is divided into that originating from the tissue interfaces and that originating from sub-resolution diffuse scatterers. In the simplified models, the magnitude of the reverberation clutter is observed as angle and density of the connective tissue are altered. The results suggest that multi-path scattering from the connective tissue/fat interfaces is a dominant component of reverberation clutter. Diffuse reverberation clutter is maximal when the connective tissue is near normal to the beam direction and increases with the density of connective tissue layers at these large angles. The presence of a thick fascial or fibrous layer at the distal boundary of the abdominal wall magnifies the amount of reverberation clutter. The simulations also illustrate that compression of the abdominal layer, a technique often used to mitigate clutter in overweight and obese patients, increases the decay of reverberation clutter with depth. In addition, rotation of the transducer or steering of the beam with respect to highly reflecting boundaries can reduce coherent clutter and transform it to diffuse clutter, which can be further reduced using coherence-based beamforming techniques. In vivo images of the human bladder illustrate some of the reverberation effects observed in simulation.

Keywords: Acoustic noise; Artifact; Clutter; Reverberation; Ultrasonic imaging.


Figures

Fig. 1
Fig. 1
Subcutaneous tissue layers in the abdomen of a 34-y old male. The subcutaneous tissue is divided into two major layers: the superficial adipose layer and the deep adipose layer. These layers are separated and bounded by large continuous sheets of connective tissue. The image is acquired from a Siemens S2000 system with a 14 L5 transducer in tissue harmonic imaging mode (transmit frequency = 7 MHz) and exhibits 70 dB of dynamic range with the default settings of the system.
Fig. 2
Fig. 2
Diagram of the possible paths for reverberation echoes. The dashed line on the left represents the path of a wavefront as it reflects back and forth off a thick fascial layer and the transducer face. If the scattering from the connective tissue is weak, then a replica of the abdominal wall will appear below, with blurring caused by focusing errors. If the scattering from the connective tissues is strong, then a wavefront may reflect many times off the connective tissue layers, either along the same path or along multiple paths, as shown by the dashed-dotted line on the right. A combination of both types of scattering is also possible.
Fig. 3
Fig. 3
Example models of the simplified subcutaneous tissue models used in the non-linear, full-wave simulation method illustrating (top) shallow (5°) and (bottom) steep (75°) angles relative to the direction of beam propagation. The full simulation field has been cropped to better illustrate the models of the subcutaneous anatomy.
Fig. 4
Fig. 4
In vivo image of a human bladder demonstrating a band of clutter in the proximal region of the bladder. The image exhibits 50 dB of dynamic range. Coherent clutter is visible in the upper left of the bladder cavity and more subtly at the bottom of the clutter band. Diffuse clutter is present throughout the band.
Fig. 5
Fig. 5
Simulated ultrasound image of an abdominal wall with an anechoic region beneath it, exhibiting 60 dB of dynamic range. The abdominal wall generates diffuse and coherent acoustic noise in the region beneath it. The acoustic noise here is similar in composition to that observed in the in vivo bladder.
Fig. 6
Fig. 6
The thickness of the clutter band is highly correlated with the thickness of the abdominal wall. The equation of the regression line is y = 0.98x − 0.11, indicating that the thickness of the clutter band is nearly equal to the thickness of the abdominal wall.
Fig. 7
Fig. 7
In vivo images illustrating the compression of the abdominal wall above the bladder. The images exhibit 50 dB of dynamic range and illustrate increasing compression from top to bottom. Diffuse clutter within the bladder cavity decreases with increasing compression. The sizes of the visible clutter bands in the middle and bottom images are 2.50 and 2.04 cm, respectively.
Fig. 8
Fig. 8
Average magnitude of acoustical noise observed beneath the abdominal wall in Figure 5. The clutter exhibits a distinct staircase pattern associated with the thickness of the abdominal wall, with the step width decreasing as the wall is compressed. The standard deviation from the mean is represented by the shaded error bars.
Fig. 9
Fig. 9
(a) Average decay in the magnitude of the clutter as a function of the thickness of the complete (tissue plus scatterers) abdominal wall. (b) By separating the sources of scattering into constituent parts, it is apparent that multi-path scattering between connective and other tissue is the dominant source of the clutter. (c) Average decay for tissue layers only. (d) Average decay for diffuse sub-resolution scatterers only.
Fig. 10
Fig. 10
(a) Magnitude of diffuse clutter beneath the abdominal wall as a function of connective tissue angle with a connective tissue density of 2 connective tissue layers (ctl)/cm2. (b) Magnitude of diffuse clutter as a function of connective tissue density at an angle of 5°. (c) Magnitude as a function of connective tissue density at an angle of 75°.
Fig. 11
Fig. 11
Average magnitude of reverberation clutter observed beneath an abdominal wall as the angle between the transducer and the wall is increased. The stepping pattern of the clutter gradually disappears with increasing angle. The composition of the clutter exhibits a greater amount of coherent clutter at low angles and changes to more diffuse clutter at the larger angles. The standard deviation from the mean is represented by the shaded error bars in the 15° plot. The standard deviations of the other plots are omitted for clarity.
Fig. 12
Fig. 12
Images illustrating the change in reverberation clutter as the angle between the transducer and abdominal wall is increased. The images exhibit 60 dB of dynamic range. The coherent clutter visible at 0° rotation becomes increasingly diffuse with increasing angle, while the diffuse clutter decreases in magnitude.
Fig. 13
Fig. 13
Simulated images illustrating the impact of the angle between the transmit beam and the connective tissue layers. From left to right are the original image of the abdominal layer and the resulting clutter using the full aperture, followed by images from each of the four sub-apertures. All images exhibit 60 dB of dynamic range. Coherent clutter is more visible from the two center sub-apertures than from the two outer apertures, which have smaller beam angles relative to the connective tissue.

References

    1. Averkiou MA, Roundhill DN, Powers JE. Proceedings, IEEE Ultrasonics Symposium, 1997. Vol. 2. IEEE; New York: 1997. A new imaging technique based on the nonlinear properties of tissues; pp. 1561–1566.
    1. Brunke SS, Insana MF, Dahl JJ, Hansen C, Ashfaq M, Ermert H. An ultrasound research interface for a clinical system. IEEE Trans Ultrason Ferroelectr Freq Control. 2007;54:198–210. - PubMed
    1. Buttery B, Davison G. The ghost artifact. J Ultrasound Med. 1984;3:49–52. - PubMed
    1. Christopher T. Finite amplitude distortion-based inhomogeneous pulse echo ultrasonic imaging. IEEE Trans Ultrason Ferroelect Freq Control. 1997;44:125–139. - PubMed
    1. Dahl JJ, Jakovljevic M, Pinton GF, Trahey GE. Harmonic spatial coherence imaging: An ultrasonic imaging method based on backscatter coherence. IEEE Trans Ultrason Ferroelectr Freq Control. 2012;59:648–659. - PMC - PubMed

Publication types