

Permutation inference for the general linear model
- PMID: 24530839
- PMCID: PMC4010955
- DOI: 10.1016/j.neuroimage.2014.01.060
Permutation inference for the general linear model
Abstract
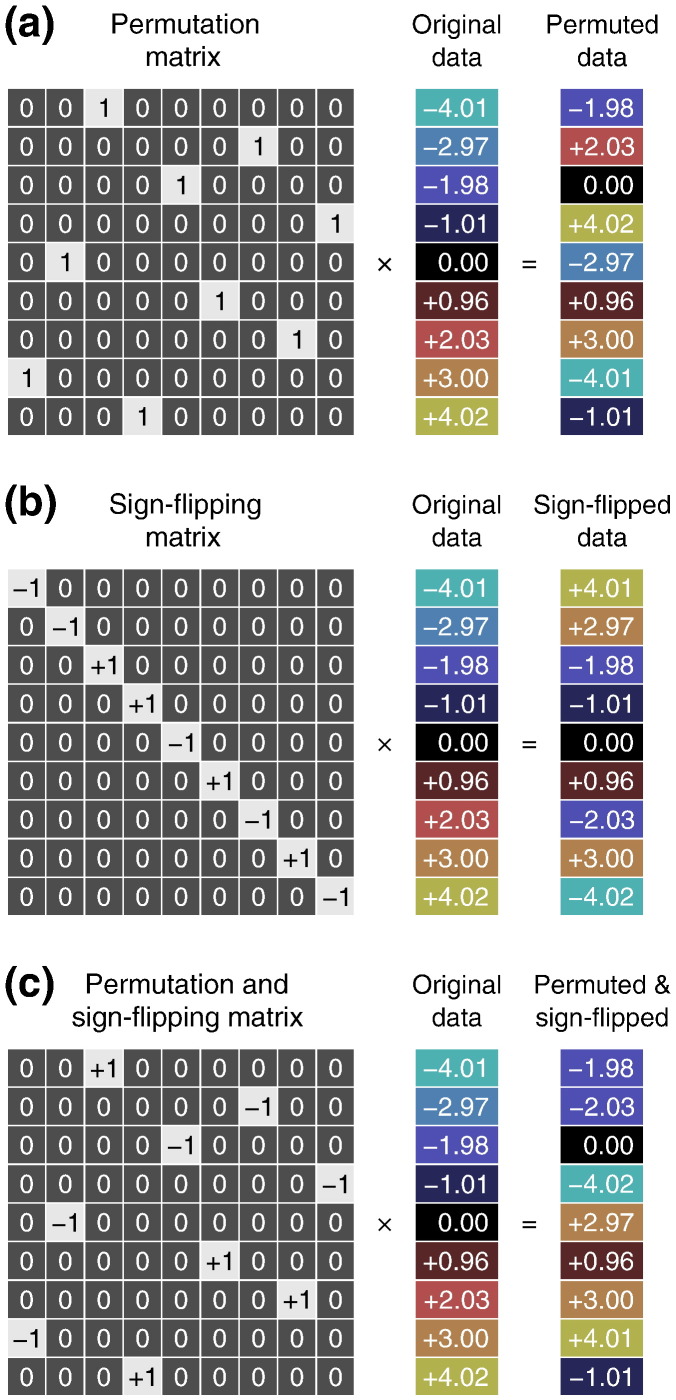
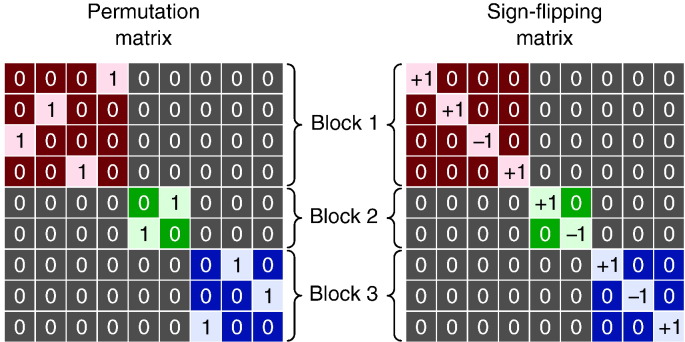
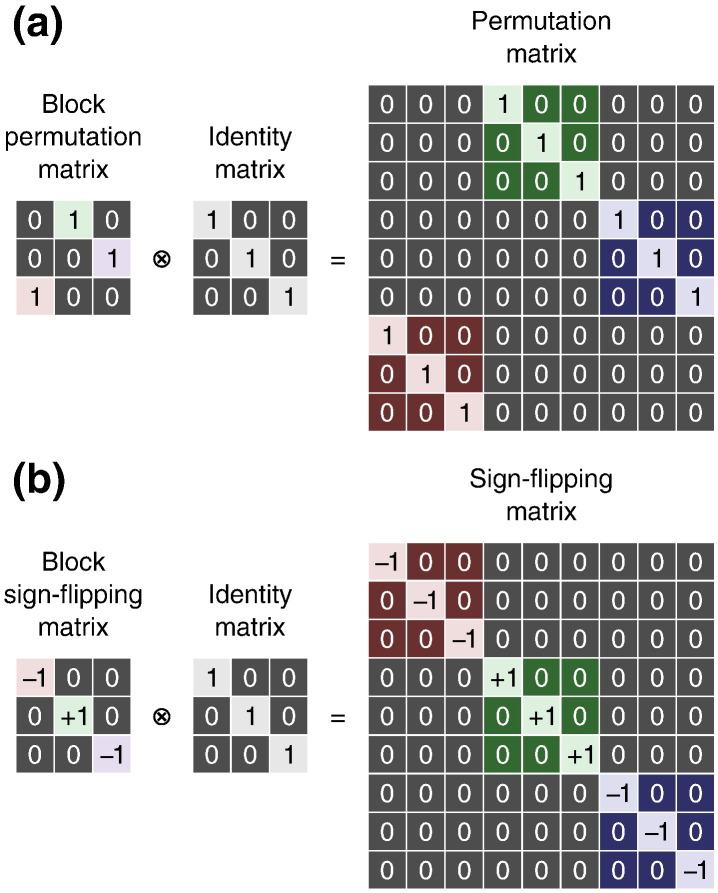
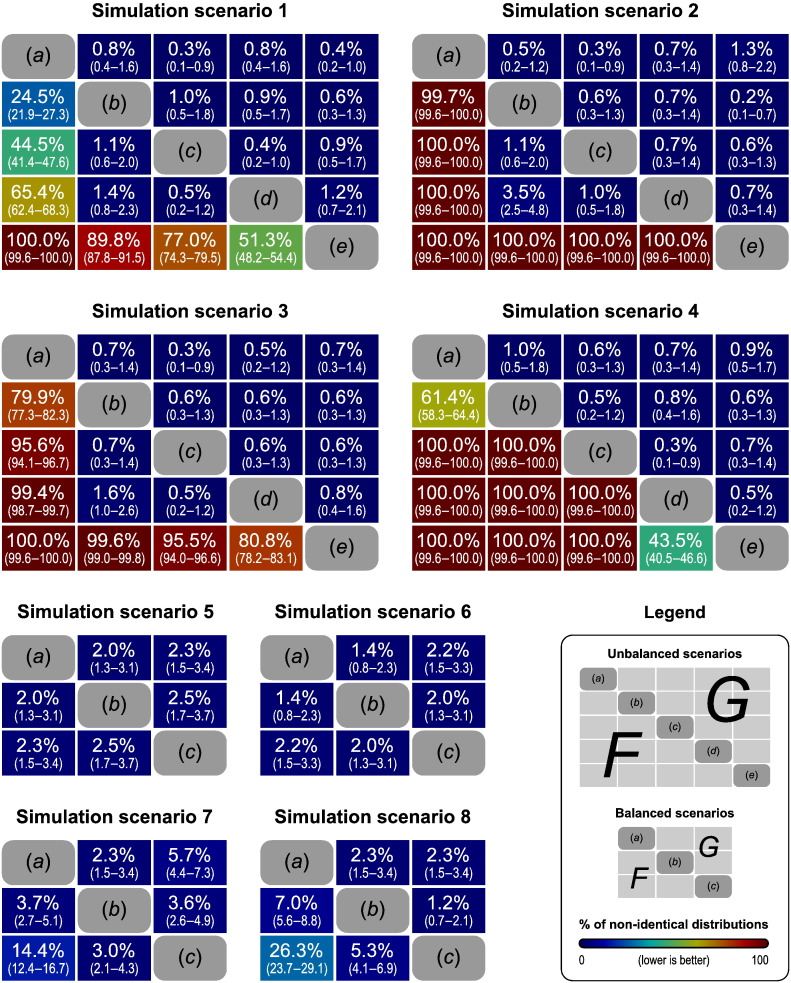
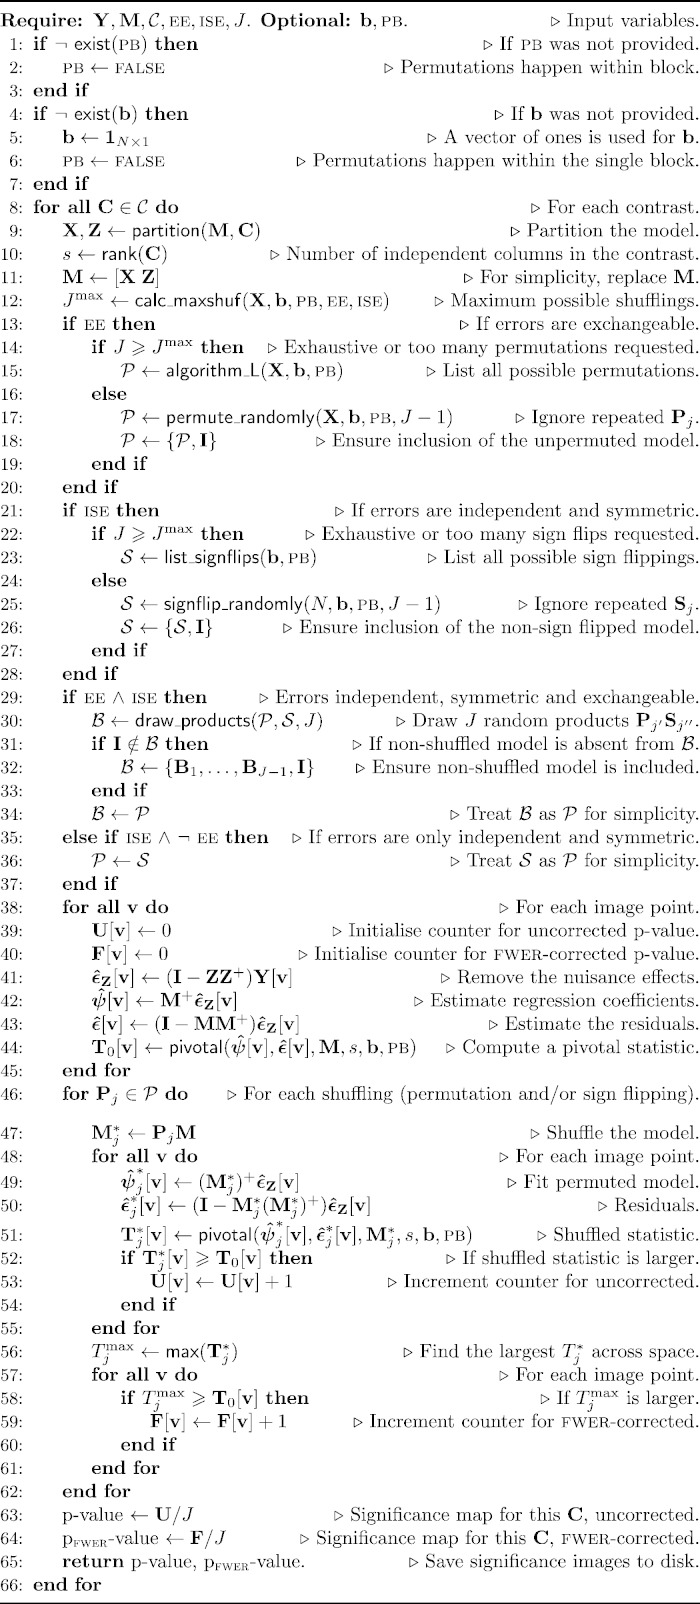
Permutation methods can provide exact control of false positives and allow the use of non-standard statistics, making only weak assumptions about the data. With the availability of fast and inexpensive computing, their main limitation would be some lack of flexibility to work with arbitrary experimental designs. In this paper we report on results on approximate permutation methods that are more flexible with respect to the experimental design and nuisance variables, and conduct detailed simulations to identify the best method for settings that are typical for imaging research scenarios. We present a generic framework for permutation inference for complex general linear models (GLMS) when the errors are exchangeable and/or have a symmetric distribution, and show that, even in the presence of nuisance effects, these permutation inferences are powerful while providing excellent control of false positives in a wide range of common and relevant imaging research scenarios. We also demonstrate how the inference on GLM parameters, originally intended for independent data, can be used in certain special but useful cases in which independence is violated. Detailed examples of common neuroimaging applications are provided, as well as a complete algorithm - the "randomise" algorithm - for permutation inference with the GLM.
Keywords: General linear model; Multiple regression; Permutation inference; Randomise.
Copyright © 2014 The Authors. Published by Elsevier Inc. All rights reserved.
Figures
References
-
- Anderson M.J., Legendre P. An empirical comparison of permutation methods for tests of partial regression coefficients in a linear model. J. Stat. Comput. Simul. 1999;62(3):271–303.
-
- Anderson M.J., Robinson J. Permutation tests for linear models. Aust. N.Z. J. Stat. 2001;43(1):75–88.
-
- Anderson M., ter Braak C.J.F. Permutation tests for multi-factorial analysis of variance. J. Stat. Comput. Simul. 2003;73(2):85–113.
-
- Arndt S., Cizadlo T., Andreasen N.C., Heckel D., Gold S., O'Leary D.S. Tests for comparing images based on randomization and permutation methods. J. Cereb. Blood Flow Metab. 1996;16(6):1271–1279. - PubMed
-
- Aspin A.A., Welch B.L. Tables for use in comparisons whose accuracy involves two variances, separately estimated. Biometrika. 1949;36(3):290–296. - PubMed
Publication types
MeSH terms
Grants and funding
LinkOut - more resources
Full Text Sources
Other Literature Sources
Medical
