

Link between DNA damage and centriole disengagement/reduplication in untransformed human cells
- PMID: 24532022
- PMCID: PMC4122266
- DOI: 10.1002/jcp.24579
Link between DNA damage and centriole disengagement/reduplication in untransformed human cells
Abstract
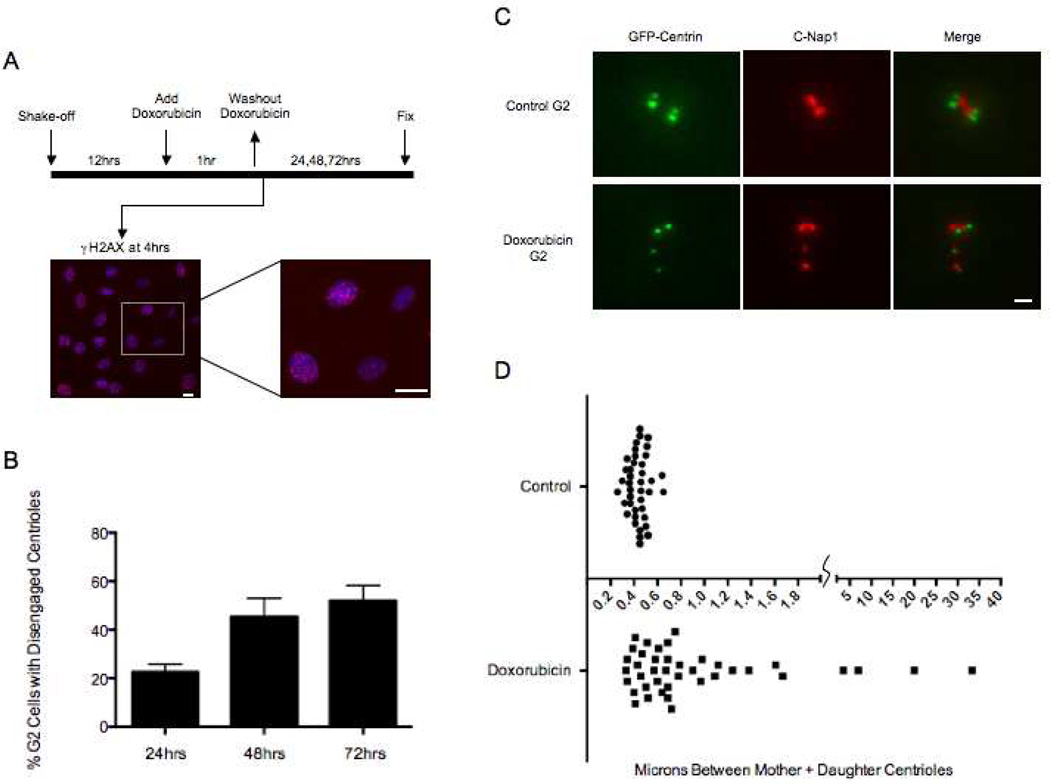
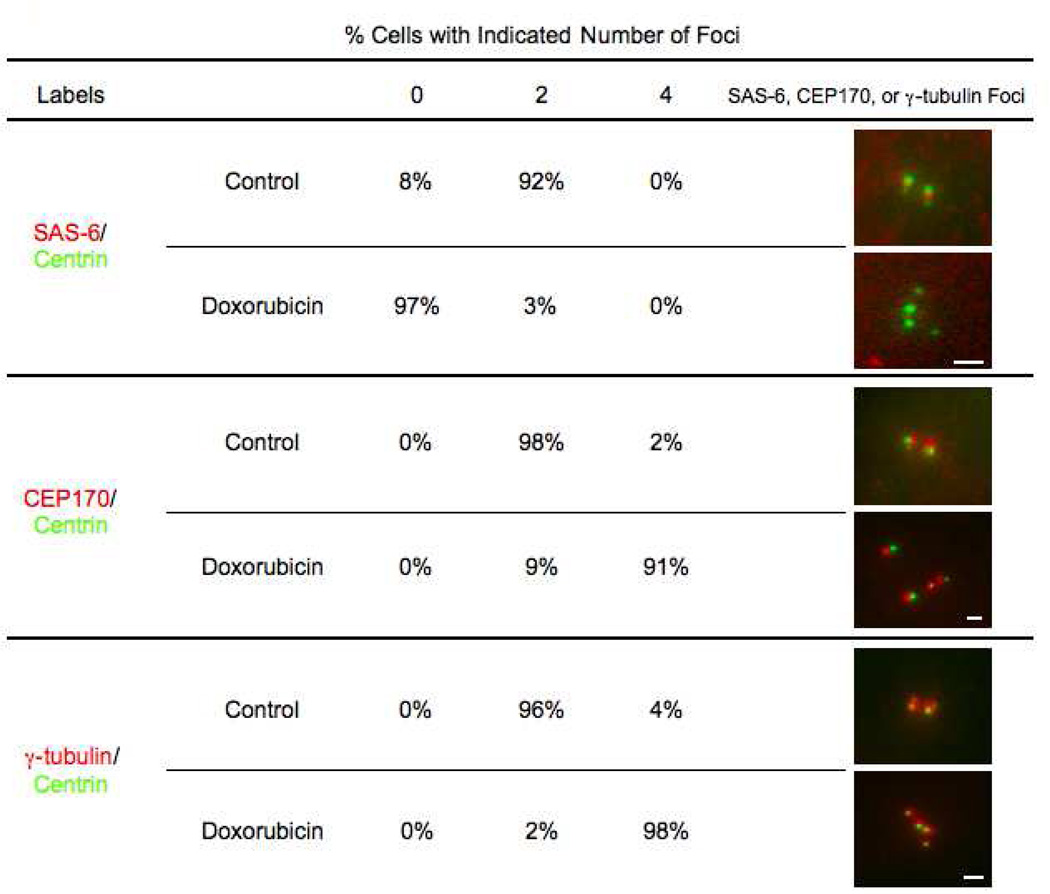
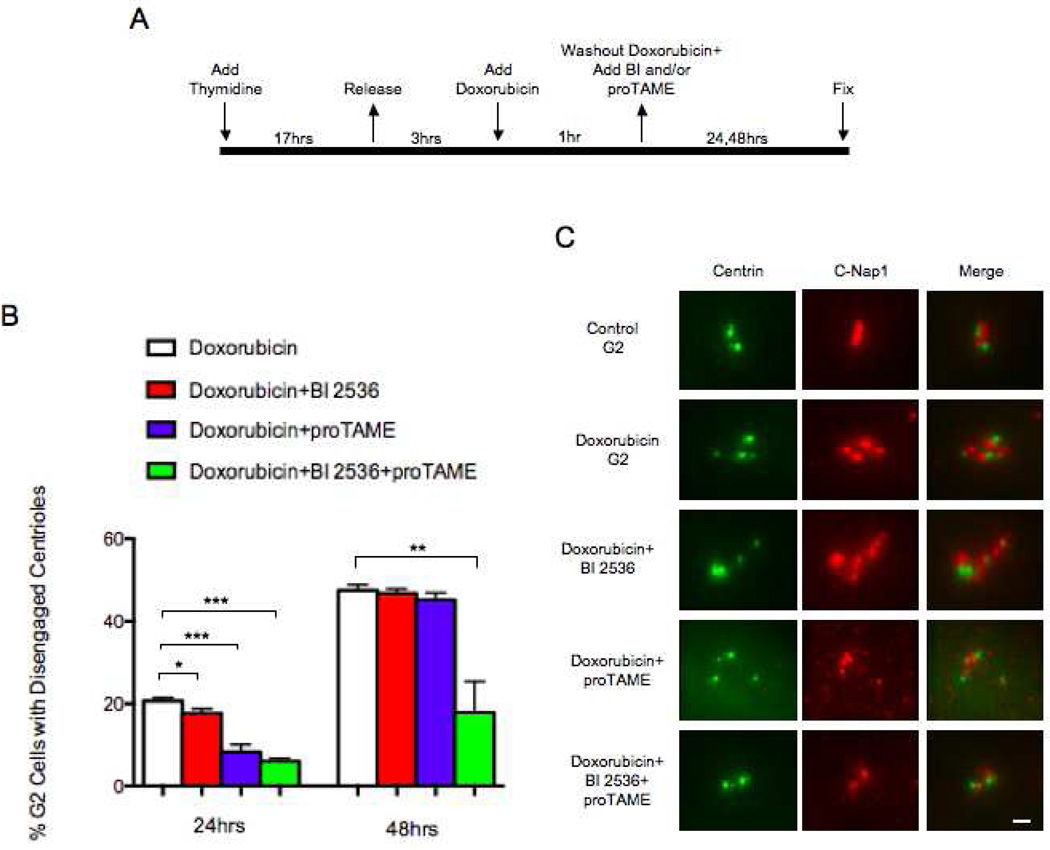
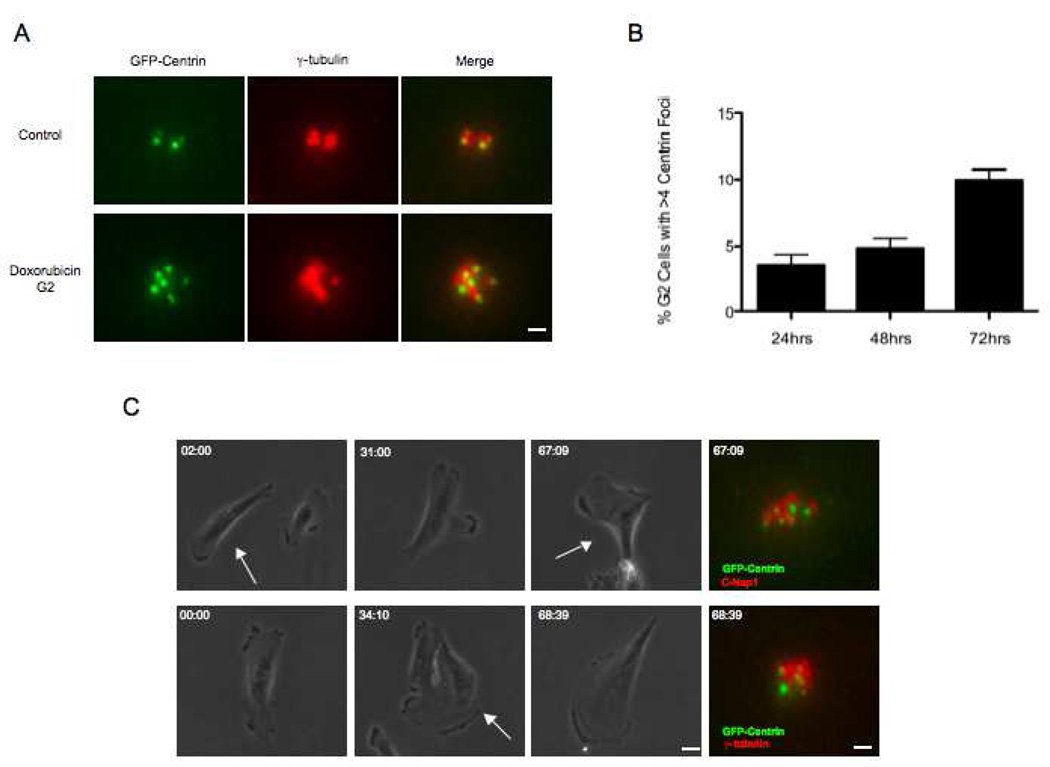
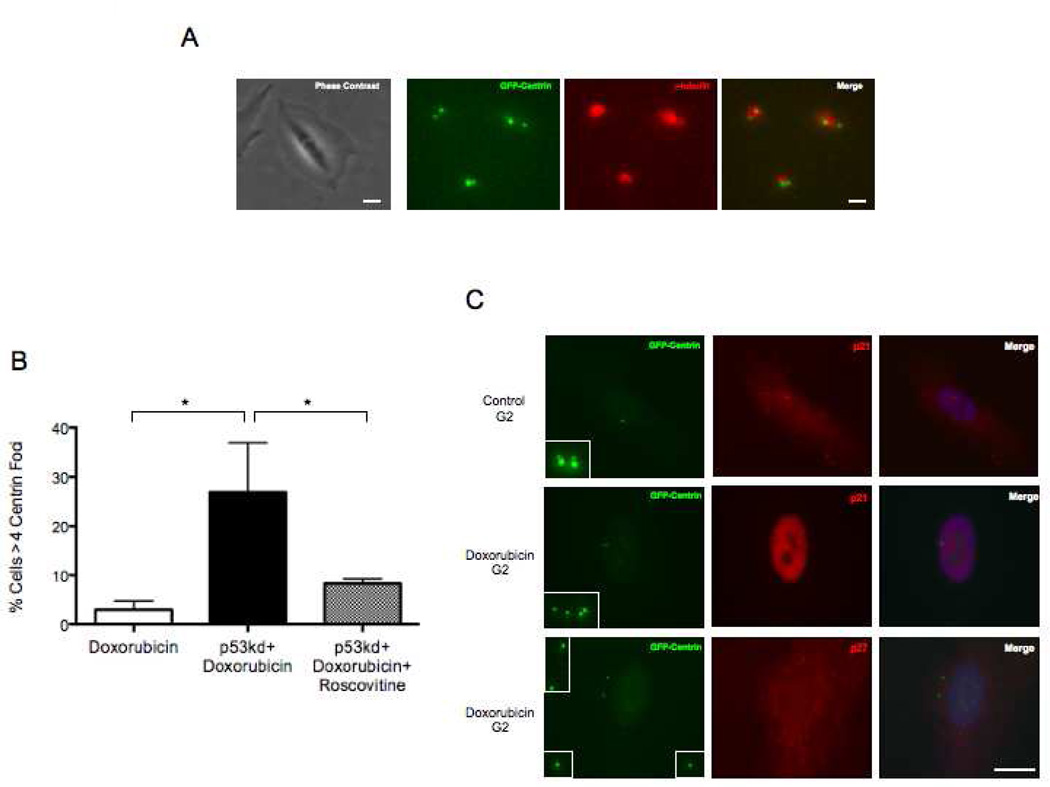
The radiation and radiomimetic drugs used to treat human tumors damage DNA in both cancer cells and normal proliferating cells. Centrosome amplification after DNA damage is well established for transformed cell types but is sparsely reported and not fully understood in untransformed cells. We characterize centriole behavior after DNA damage in synchronized untransformed human cells. One hour treatment of S phase cells with the radiomimetic drug, Doxorubicin, prolongs G2 by at least 72 h, though 14% of the cells eventually go through mitosis in that time. By 72 h after DNA damage we observe a 52% incidence of centriole disengagement plus a 10% incidence of extra centrioles. We find that either APC/C or Plk activities can disengage centrioles after DNA damage, though they normally work in concert. All disengaged centrioles are associated with γ-tubulin and maturation markers and thus, should in principle be capable of reduplicating and organizing spindle poles. The low incidence of reduplication of disengaged centrioles during G2 is due to the p53-dependent expression of p21 and the consequent loss of Cdk2 activity. We find that 26% of the cells going through mitosis after DNA damage contain disengaged or extra centrioles. This could produce genomic instability through transient or persistent spindle multipolarity. Thus, for cancer patients the use of DNA damaging therapies raises the chances of genomic instability and evolution of transformed characteristics in proliferating normal cell populations.
© 2014 Wiley Periodicals, Inc.
Figures
Similar articles
-
Oscillation of APC/C activity during cell cycle arrest promotes centrosome amplification.J Cell Sci. 2012 Nov 15;125(Pt 22):5353-68. doi: 10.1242/jcs.106096. Epub 2012 Sep 6. J Cell Sci. 2012. PMID: 22956538 Free PMC article.
-
Growth disadvantage associated with centrosome amplification drives population-level centriole number homeostasis.Mol Biol Cell. 2020 Nov 15;31(24):2646-2656. doi: 10.1091/mbc.E19-04-0195. Epub 2020 Sep 23. Mol Biol Cell. 2020. PMID: 32966175 Free PMC article.
-
The conversion of centrioles to centrosomes: essential coupling of duplication with segregation.J Cell Biol. 2011 May 16;193(4):727-39. doi: 10.1083/jcb.201101109. J Cell Biol. 2011. PMID: 21576395 Free PMC article.
-
Plk1 relieves centriole block to reduplication by promoting daughter centriole maturation.Nat Commun. 2015 Aug 21;6:8077. doi: 10.1038/ncomms9077. Nat Commun. 2015. PMID: 26293378 Free PMC article.
-
Breaking the ties that bind: new advances in centrosome biology.J Cell Biol. 2012 Apr 2;197(1):11-8. doi: 10.1083/jcb.201108006. J Cell Biol. 2012. PMID: 22472437 Free PMC article. Review.
Cited by
-
Chronic Exposure to Particulate Chromate Induces Premature Centrosome Separation and Centriole Disengagement in Human Lung Cells.Toxicol Sci. 2015 Oct;147(2):490-9. doi: 10.1093/toxsci/kfv146. Epub 2015 Aug 19. Toxicol Sci. 2015. PMID: 26293554 Free PMC article.
-
Centriole splitting caused by loss of the centrosomal linker protein C-NAP1 reduces centriolar satellite density and impedes centrosome amplification.Mol Biol Cell. 2017 Mar 15;28(6):736-745. doi: 10.1091/mbc.E16-05-0325. Epub 2017 Jan 18. Mol Biol Cell. 2017. PMID: 28100636 Free PMC article.
-
Centrosomes and cancer: revisiting a long-standing relationship.Nat Rev Cancer. 2015 Nov;15(11):639-52. doi: 10.1038/nrc3995. Nat Rev Cancer. 2015. PMID: 26493645 Review.
-
DNA Replication Stress and Chromosomal Instability: Dangerous Liaisons.Genes (Basel). 2020 Jun 10;11(6):642. doi: 10.3390/genes11060642. Genes (Basel). 2020. PMID: 32532049 Free PMC article. Review.
-
Etoposide Triggers Cellular Senescence by Inducing Multiple Centrosomes and Primary Cilia in Adrenocortical Tumor Cells.Cells. 2021 Jun 11;10(6):1466. doi: 10.3390/cells10061466. Cells. 2021. PMID: 34208028 Free PMC article.
References
-
- Bahassi EM. Polo-like kinases and DNA damage checkpoint: beyond the traditional mitotic functions. Exp Biol Med (Maywood) 2011;236:648–657. - PubMed
-
- Bourke E, Brown JAL, Takeda S, Hochegger H, Morrison CG. DNA damage induces Chk1-dependent threonine-160 phosphorylation and activation of Cdk2. Oncogene. 2010;29:616–624. - PubMed
-
- Brinkley BR. Managing the centrosome numbers game: from chaos to stability in cancer cell division. Trends Cell Biol. 2001;11:18–21. - PubMed
Publication types
MeSH terms
Substances
Grants and funding
LinkOut - more resources
Full Text Sources
Other Literature Sources
Research Materials
Miscellaneous
