

Cortactin, another player in the Lyn signaling pathway, is over-expressed and alternatively spliced in leukemic cells from patients with B-cell chronic lymphocytic leukemia
- PMID: 24532043
- PMCID: PMC4040911
- DOI: 10.3324/haematol.2013.090183
Cortactin, another player in the Lyn signaling pathway, is over-expressed and alternatively spliced in leukemic cells from patients with B-cell chronic lymphocytic leukemia
Abstract
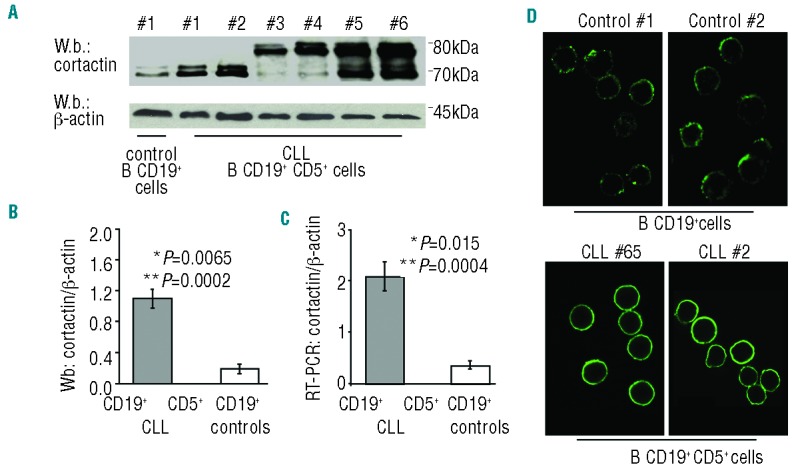
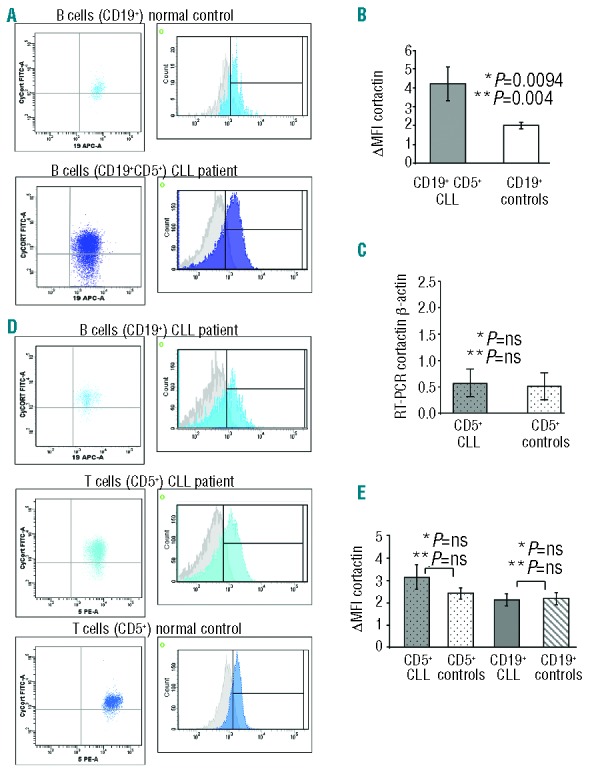
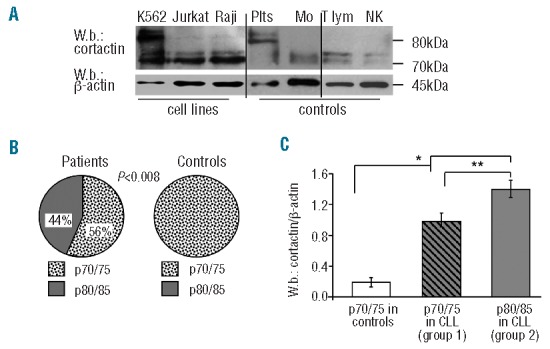
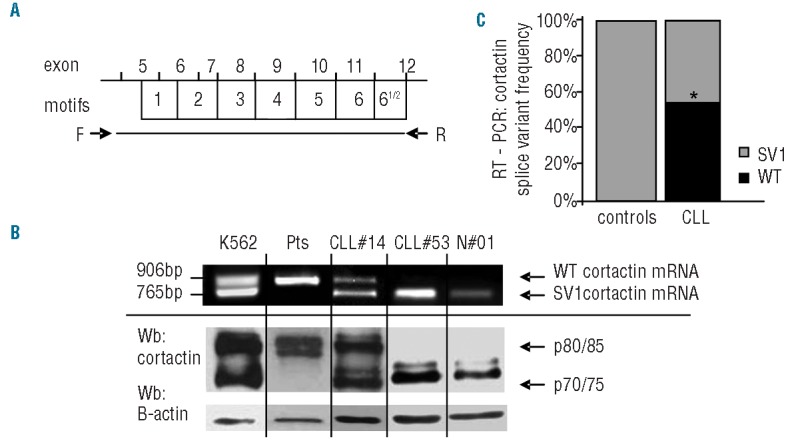
Cortactin, an actin binding protein and Lyn substrate, is up-regulated in several cancers and its level is associated with increased cell migration, metastasis and poor prognosis. The identification that the Src kinase Lyn and its substrate HS1 are over-expressed in B-cell chronic lymphocytic leukemia and involved in resistance to chemotherapy and poor prognosis, prompted us to investigate the role of cortactin, an HS1 homolog, in the pathogenesis and progression of this disorder. In this study, we observed that cortactin is over-expressed in leukemic cells of patients (1.10 ± 0.12) with respect to normal B lymphocytes (0.19 ± 0.06; P=0.0065). Fifty-three percent of our patients expressed the WT mRNA and p80/85 protein isoforms, usually lacking in normal B lymphocytes which express the SV1 variant and the p70/75 protein isoforms. Moreover, we found an association of the cortactin overexpression and negative prognostic factors, including ZAP-70 (P<0.01), CD38 (P<0.01) and somatic hypermutations in the immunoglobulin heavy-chain variable region (P<0.01). Our results show that patients with B-cell chronic lymphocytic leukemia express high levels of cortactin with a particular overexpression of the WT isoform that is lacking in normal B cells, and a correlation to poor prognosis, suggesting that this protein could be relevant in the pathogenesis and aggressiveness of the disease.
Copyright© Ferrata Storti Foundation.
Figures
Similar articles
-
HS1, a Lyn kinase substrate, is abnormally expressed in B-chronic lymphocytic leukemia and correlates with response to fludarabine-based regimen.PLoS One. 2012;7(6):e39902. doi: 10.1371/journal.pone.0039902. Epub 2012 Jun 29. PLoS One. 2012. PMID: 22768161 Free PMC article.
-
Cortactin, a Lyn substrate, is a checkpoint molecule at the intersection of BCR and CXCR4 signalling pathway in chronic lymphocytic leukaemia cells.Br J Haematol. 2017 Jul;178(1):81-93. doi: 10.1111/bjh.14642. Epub 2017 Apr 17. Br J Haematol. 2017. PMID: 28419476
-
Chronic lymphocytic leukemia B cells contain anomalous Lyn tyrosine kinase, a putative contribution to defective apoptosis.J Clin Invest. 2005 Feb;115(2):369-78. doi: 10.1172/JCI22094. J Clin Invest. 2005. PMID: 15650771 Free PMC article.
-
Cortactin Expression in Hematopoietic Cells: Implications for Hematological Malignancies.Am J Pathol. 2020 May;190(5):958-967. doi: 10.1016/j.ajpath.2019.12.011. Epub 2020 Feb 18. Am J Pathol. 2020. PMID: 32084363 Review.
-
Hematopoietic cell-specific lyn substrate (HCLS1 or HS1): A versatile actin-binding protein in leukocytes.J Leukoc Biol. 2019 May;105(5):881-890. doi: 10.1002/JLB.MR0618-212R. Epub 2018 Dec 11. J Leukoc Biol. 2019. PMID: 30537294 Review.
Cited by
-
Induced transcription and stability of CELF2 mRNA drives widespread alternative splicing during T-cell signaling.Proc Natl Acad Sci U S A. 2015 Apr 28;112(17):E2139-48. doi: 10.1073/pnas.1423695112. Epub 2015 Apr 13. Proc Natl Acad Sci U S A. 2015. PMID: 25870297 Free PMC article.
-
NanoPipe-a web server for nanopore MinION sequencing data analysis.Gigascience. 2019 Feb 1;8(2):giy169. doi: 10.1093/gigascience/giy169. Gigascience. 2019. PMID: 30689855 Free PMC article.
-
Mesenchymal stem cells enhance tumorigenic properties of human glioblastoma through independent cell-cell communication mechanisms.Oncotarget. 2018 May 15;9(37):24766-24777. doi: 10.18632/oncotarget.25346. eCollection 2018 May 15. Oncotarget. 2018. PMID: 29872504 Free PMC article.
-
Hematopoietic lineage cell-specific protein 1 immunoreactivity indicates an increased risk of poor overall survival in patients with ovarian carcinoma.Oncol Lett. 2018 Jun;15(6):9406-9412. doi: 10.3892/ol.2018.8493. Epub 2018 Apr 13. Oncol Lett. 2018. PMID: 29805664 Free PMC article.
-
Aberrant spliceosome activity via elevated intron retention and upregulation and phosphorylation of SF3B1 in chronic lymphocytic leukemia.Mol Ther Nucleic Acids. 2024 Apr 26;35(2):102202. doi: 10.1016/j.omtn.2024.102202. eCollection 2024 Jun 11. Mol Ther Nucleic Acids. 2024. PMID: 38846999 Free PMC article.
References
-
- Parsons SJ, Parsons JT. Src family kinases, key regulators of signal transduction. Oncogene 2004;23(48):7906–9 - PubMed
-
- Frame MC. Src in cancer: deregulation and consequences for cell behaviour. Biochim Biophys Acta 2002;1602(2):114–30 - PubMed
-
- Xu Y, Harder KW, Huntington ND, Hibbs ML, Tarlinton DM. Lyn tyrosine kinase: accentuating the positive and the negative. Immunity 2005;22(1):9–18 - PubMed
-
- Reth M. Antigen receptor tail clue. Nature 1989;338(6214):383–4 - PubMed
Publication types
MeSH terms
Substances
LinkOut - more resources
Full Text Sources
Other Literature Sources
Research Materials
Miscellaneous
