. 2014 Jun;95(6):917-30.
doi: 10.1189/jlb.0913486. Epub 2014 Feb 14.

Cot/tpl2 participates in the activation of macrophages by adiponectin

Affiliations

Cot/tpl2 participates in the activation of macrophages by adiponectin

Carlos Sanz-Garcia et al. J Leukoc Biol. 2014 Jun.

Abstract

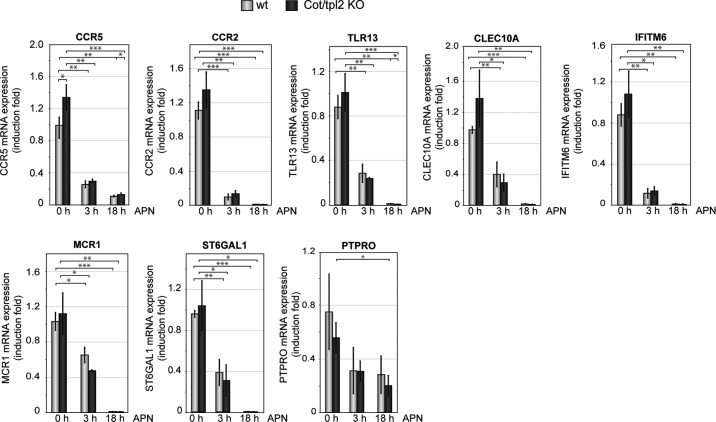
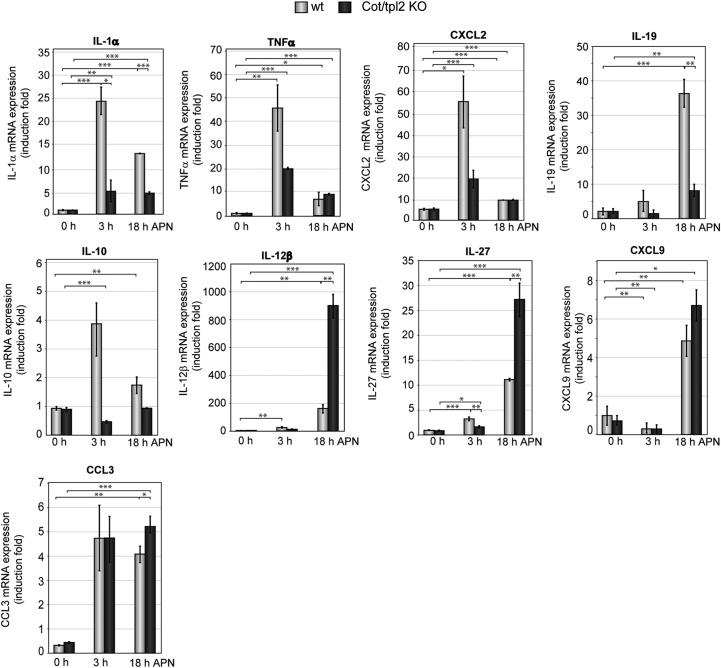
Whereas the main function of APN is to enhance insulin activity, it is also involved in modulating the macrophage phenotype. Here, we demonstrate that at physiological concentrations, APN activates Erk1/2 via the IKKβ-p105/NF-κΒ1-Cot/tpl2 intracellular signal transduction cassette in macrophages. In peritoneal macrophages stimulated with APN, Cot/tpl2 influences the ability to phagocytose beads. However, Cot/tpl2 did not modulate the known capacity of APN to decrease lipid content in peritoneal macrophages in response to treatment with oxLDL or acLDL. A microarray analysis of gene-expression profiles in BMDMs exposed to APN revealed that APN modulated the expression of ∼3300 genes; the most significantly affected biological functions were the inflammatory and the infectious disease responses. qRT-PCR analysis of WT and Cot/tpl2 KO macrophages stimulated with APN for 0, 3, and 18 h revealed that Cot/tpl2 participated in the up-regulation of APN target inflammatory mediators included in the cytokine-cytokine receptor interaction pathway (KEGG ID 4060). In accordance with these data, macrophages stimulated with APN increased secretion of cytokines and chemokines, including IL-1β, IL-1α, TNF-α, IL-10, IL-12, IL-6, and CCL2. Moreover, Cot/tpl2 also played an important role in the production of these inflammatory mediators upon stimulation of macrophages with APN. It has been reported that different types of signals that stimulate TLRs, IL-1R, TNFR, FcγR, and proteinase-activated receptor-1 activate Cot/tpl2. Here, we demonstrate that APN is a new signal that activates the IKKβ-p105/NF-κΒ1-Cot/tpl2-MKK1/2-Erk1/2 axis in macrophages. Furthermore, this signaling cassette modulates the biological functions triggered by APN in macrophages.

Keywords: M1 polarization; MAP kinases; fat-derived hormone; foam cells; mircroarray; phagocytosis.


Figures

Figure 1.
Figure 1.. Erk1/2 activation in macrophages stimulated with APN.
(A) WT, TLR2/4 KO, and Cot/tpl2 KO BMDMs were incubated with APN (12 μg/ml) and at the indicated times; the levels of P-Erk1/2 and Erk2 were measured by immunoblotting. (B) WT and Cot/tpl2 KO BMDMs were treated as in A, and the levels of S473 Akt and total Akt were measured by immunoblotting. (C) WT BMDMs were incubated with APN (12 μg/ml in 15–30 μl), control-APN (Cnt; 15–30 μl), or LPS (300 ng/ml) for the indicated times and treated as in A. (D) RAW cells were nucleofected with 100 nM control (Sca) or with specific AdipoR1 (APNR1) and/or AdipoR2 (APNR2) for 24 h. Efficiency of siRNA knockdown was determined by qRT-PCR analysis. Data show the mean ± sd from eight independent experiments expressed relative to the control. (E) RAW cells nucleofected with scramble (Sca) or with specific siRNA AdipoR1 and/or AdipoR2 for 24 h were subsequently stimulated for 45 min with APN (12 μg/ml) and then treated as in A. siAdipoR1/2, Small interfering AdipoR1/2. C, control. (F) WT and Cot/tpl2 KO hepatocytes were stimulated for the indicated times with APN (12 μg/ml), and the levels of P-AMPK, P-p38α, P-Erk1/2, p38α, and Erk2 were determined by immunoblotting. (A–F) One representative experiment of the at least three performed is shown.
Figure 2.
Figure 2.. IKKβ-p105/NF-κΒ1-Cot/tpl2-MKK1/2 mediates Erk1/2 activation in macrophages stimulated with APN.
(A) RAW cells pretreated or not with 5 μM Cot/tpl2 inhibitor (C1) were stimulated for another hour with commercial APN (6 μg/ml); the levels of P-p105/NF-κB1, P-Erk1/2, and Erk2 were measured by immunoblotting. (B) RAW cells were treated with APN (12 μg/ml), and at the marked times, the levels of the indicated proteins were measured by immunoblotting. The graph indicates the relative expression of high (H) and low (L) forms of Cot/tpl2 given the value of 100% to the one obtained at zero time-point. (C) RAW cells were stimulated with different amounts of APN for 1 h. Cells were subsequently treated as in A. Graphs show the induction fold of P-p105/NF-κB1 and P-Erk1/2 used as loading control total Erk2 levels. (D) RAW cells were incubated with APN (12 μg/ml), and at the marked times, the levels of the indicated proteins were measured by immunoblotting. Graphs represent the P-Erk1/2/Erk2, P-JNK/JNK2, and P-p38α/p38α values at 1 h APN or 30 min LPS stimulation given the value one to the control relative to zero time-point. (E) RAW cells, incubated or not with 10 μM IKKβ inhibitor B1605906 (IKKβ I), were subsequently stimulated with APN (12 μg/ml) for another hour and then treated as in A. (A–E) One representative experiment of the three performed is shown. (B–D) Graphs represent the mean ± sd of three independent experiments performed at least in duplicate.
Figure 3.
Figure 3.. qRT-PCR analysis of the top up-regulated genes in WT and Cot/tpl2 KO macrophages stimulated with APN.
The relative mRNA expression levels of the genes indicated in the figure were analyzed in WT and Cot/tpl2 KO BMDMs, stimulated or not for 3 h and 18 h with APN (12 μg/ml). Data show the mean ± sd from three different BMDM preparations obtained from two different mice each and performed in quadruplicate.
Figure 4.
Figure 4.. qRT-PCR analysis of the top down-regulated genes in WT and Cot/tpl2 KO macrophages stimulated with APN.
The relative mRNA expression levels of the genes indicated in the figure were analyzed in WT and Cot/tpl2 KO BMDMs, stimulated or not for 3 h and 18 h with APN (12 μg/ml). Data show the mean ± sd from three different BMDM preparations obtained from two different mice each and performed in quadruplicate. CLEC10A, C-type lectin domain family 10 member A; IFITM6, IFN-induced transmembrane protein 6; MCR1, melanocortin 1 receptor; ST6GAL1, ST6 β-galactosamide α-2,6-sialyltranferase 1; PTPRO, protein tyrosine phosphatase receptor type O.
Figure 5.
Figure 5.. qRT-PCR analysis of genes integrated the cytokine–cytokine receptor-interaction pathway in WT and Cot/tpl2 KO macrophages stimulated with APN.
The relative RNA expression levels of the genes indicated in the figure were analyzed in WT and Cot/tpl2 KO BMDMs, stimulated or not for 3 h and 18 h with APN (12 μg/ml). Data show the mean ± sd from three different BMDM preparations obtained from two different mice each and performed in quadruplicate.
Figure 6.
Figure 6.. Cot/tpl2 modulates cytokine production in macrophages stimulated with APN.
WT and Cot/tpl2 KO BMDMs were stimulated with APN (12 μg/ml), and the indicated cytokines and chemokines were determined in the extracellular media 18 h later using a Luminex assay. Similar results were obtained with commercial APN. The data represent the mean ± sd of four independent experiments performed in quadruplicate.
Figure 7.
Figure 7.. IL-10 partially represses COX-2, IL-6, and IL-12β mRNA levels in WT macrophages stimulated with APN.
(A) WT and Cot/tpl2 KO BMDMs were stimulated with APN (12 μg/ml) in the presence of anti-murine IL-10 (αIL-10) antibody or of control isotype IgG (5 μg/ml), and the indicated times, P-STAT3, and ERK2 expression were measured by immunoblotting. One representative experiment is shown. Graphs represent the mean ± sd of three independent experiments performed with P-STAT3/Erk2 value, given the value one to the control relative to zero time-point. (B) WT BMDMs were stimulated for 18 h, as indicated in A, and the relative RNA expression levels of COX-2, IL-6, and IL-12β were determined. Graphs represent the induction of the indicated gene in the presence of IL-10 antibody given the value of 100 to the one obtained in the absence of anti-IL-10 antibody. Data show the mean ± sd from three different experiments performed in triplicate.
Figure 8.
Figure 8.. Involvement of Cot/tpl2 in the increased phagocytosis capacity of macrophages stimulated with APN.
Resident WT and Cot/tpl2 KO peritoneal macrophages were stimulated or not with APN (12 μg/ml) for 18 h. Subsequently, ratios of 10 latex beads/cell (A) or zymosan A bioparticles at 5 μg/ml (B) were added to the cells for 3 h at 37°C or at 4°C and then treated as indicated in Experimental Procedures. Graphs represent the mean ± sd from the three different experiments performed in triplicate expressed relative to WT control.
Figure 9.
Figure 9.. Cot/tpl2 is not involved in the ability of APN to attenuate foam cell formation.
Resident WT and Cot/tpl2 KO peritoneal macrophages were stimulated for 18 h without or with APN (12 μg/ml). Subsequently, cells were incubated further with oxLDL or acLDL (40 μg/ml) for 9 h, fixed in 4% PFA, rinsed in 60% isopropanol, and stained with Oil-Red work solution and hematoxylin. Graph shows mean ± se from the four different experiments performed in quadruplicate expressed relative to WT control.

Similar articles

Cited by

References

    1. Sica A., Mantovani A. (2012) Macrophage plasticity and polarization: in vivo veritas. J. Clin. Invest. 122, 787–795 - PMC - PubMed
    1. Stout R. D., Suttles J. (2004) Functional plasticity of macrophages: reversible adaptation to changing microenvironments. J. Leukoc. Biol. 76, 509–513 - PMC - PubMed
    1. Mosser D. M., Edwards J. P. (2008) Exploring the full spectrum of macrophage activation. Nat. Rev. Immunol. 8, 958–969 - PMC - PubMed
    1. Murray P. J., Wynn T. A. (2011) Protective and pathogenic functions of macrophage subsets. Nat. Rev. Immunol. 11, 723–737 - PMC - PubMed
    1. Chen G. Y., Nunez G. (2010) Sterile inflammation: sensing and reacting to damage. Nat. Rev. Immunol. 10, 826–837 - PMC - PubMed

Publication types

MeSH terms