. 2014 May;197(1):257-71.
doi: 10.1534/genetics.114.162263. Epub 2014 Feb 14.

A penalized-likelihood method to estimate the distribution of selection coefficients from phylogenetic data

Affiliations

A penalized-likelihood method to estimate the distribution of selection coefficients from phylogenetic data

Asif U Tamuri et al. Genetics. 2014 May.

Abstract

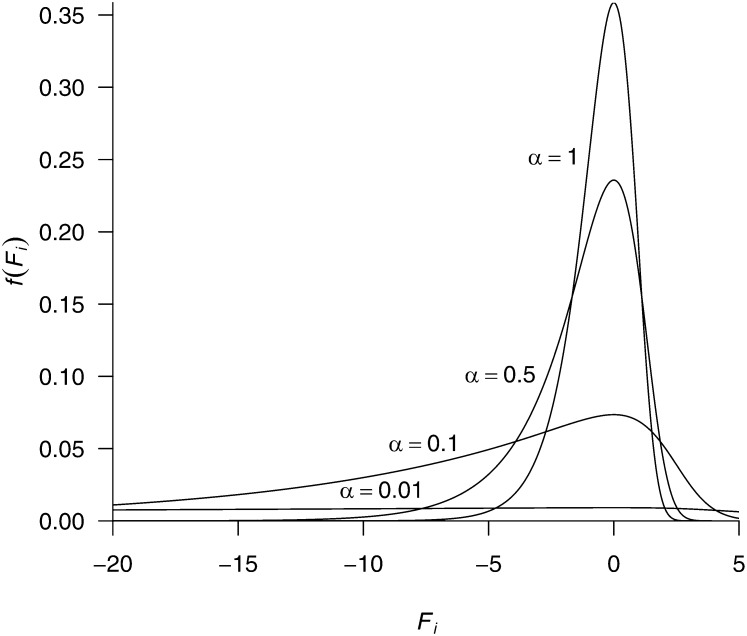
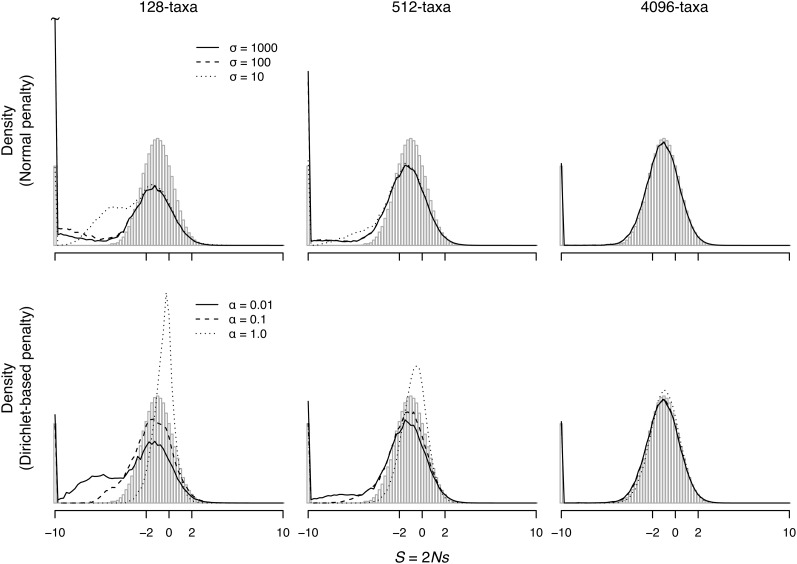
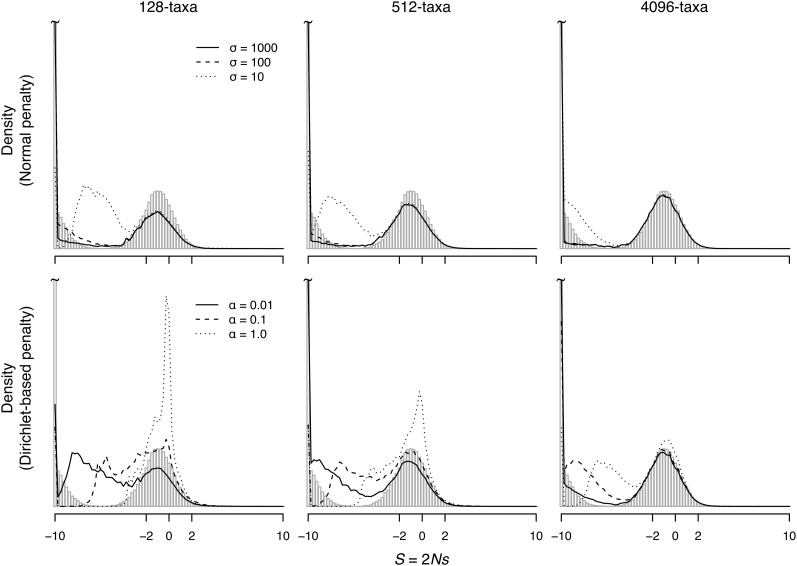
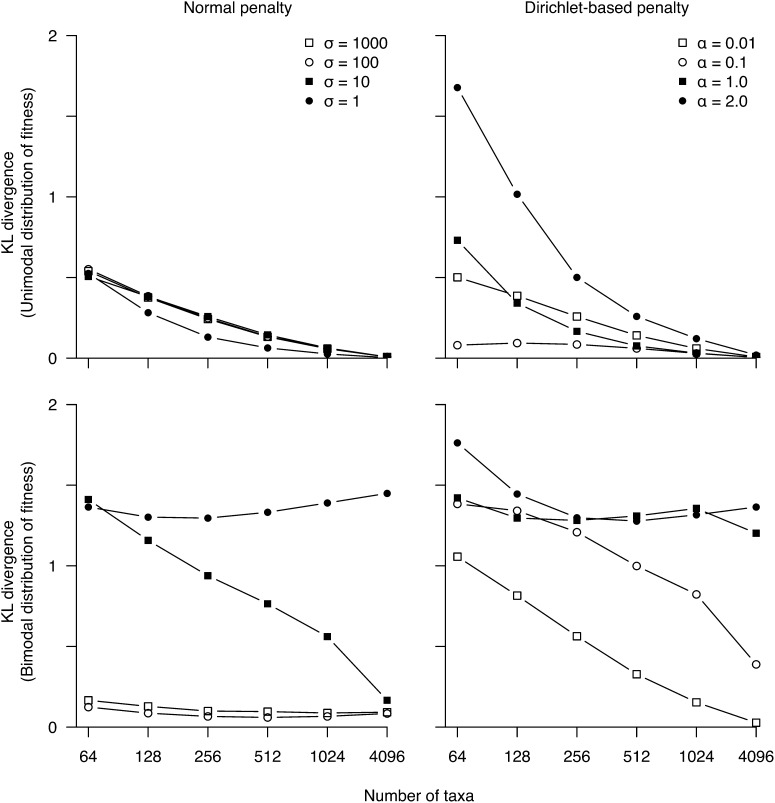
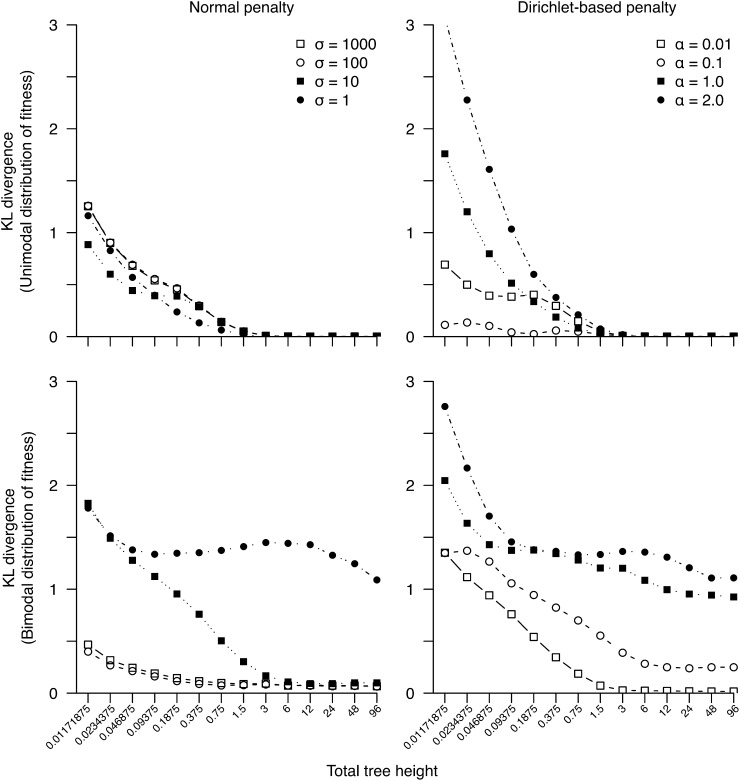
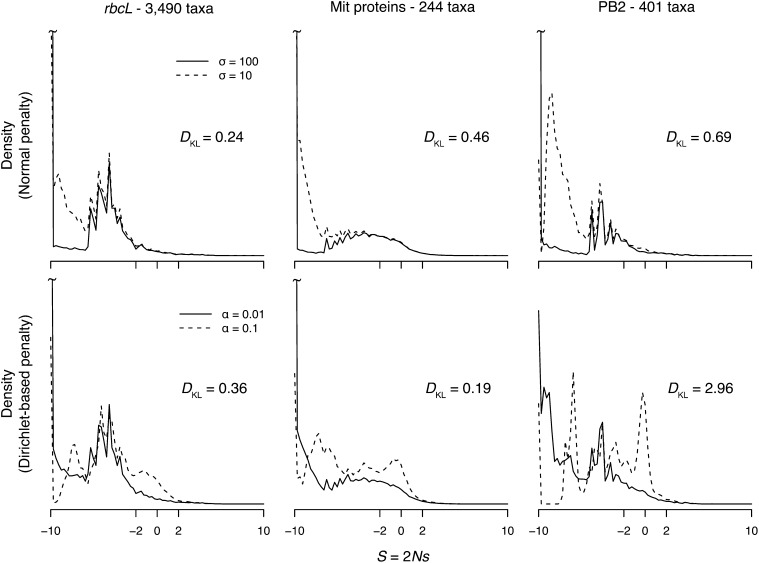
We develop a maximum penalized-likelihood (MPL) method to estimate the fitnesses of amino acids and the distribution of selection coefficients (S = 2Ns) in protein-coding genes from phylogenetic data. This improves on a previous maximum-likelihood method. Various penalty functions are used to penalize extreme estimates of the fitnesses, thus correcting overfitting by the previous method. Using a combination of computer simulation and real data analysis, we evaluate the effect of the various penalties on the estimation of the fitnesses and the distribution of S. We show the new method regularizes the estimates of the fitnesses for small, relatively uninformative data sets, but it can still recover the large proportion of deleterious mutations when present in simulated data. Computer simulations indicate that as the number of taxa in the phylogeny or the level of sequence divergence increases, the distribution of S can be more accurately estimated. Furthermore, the strength of the penalty can be varied to study how informative a particular data set is about the distribution of S. We analyze three protein-coding genes (the chloroplast rubisco protein, mammal mitochondrial proteins, and an influenza virus polymerase) and show the new method recovers a large proportion of deleterious mutations in these data, even under strong penalties, confirming the distribution of S is bimodal in these real data. We recommend the use of the new MPL approach for the estimation of the distribution of S in species phylogenies of protein-coding genes.

Keywords: chloroplast; fitness effects; influenza; mitochondria; penalized likelihood; selection coefficient.


Figures

Figure 1
Figure 1
Marginal distribution density of Fi when θ = (θi) ∼ Dirichlet(θ | α). The marginal density of θi is f(θi) = Beta(θi | α, αkα), and the marginal density of Fi is f(Fi) = f(θi) × J = Beta(θi | α, αkα) × θi(1 − θi), with θi = exp Fi/(k − 1 + exp Fi). A Dirichlet distribution with α = 1 is very informative on the transformed parameter space on F: The 95% equal-tail range of θi is (0.00133, 0.176), corresponding to a 95% range for Fi of (−3.68, 1.41).
Figure 2
Figure 2
Estimated and true distribution of S (for nonsynonymous mutations) for simulated data when the fitnesses are sampled from a unimodal distribution. The true distribution is shown as vertical shaded bars. The distributions are calculated using Equation 4 by dividing the range of S from −10 to 10 into equally spaced bins with wI = 0.25. Mutations with S ≤ −10 or those with S ≥ 10 are binned together. We consider mutations to STOP codons to be lethal, and these are included in the calculation of h(−10).
Figure 3
Figure 3
Estimated and true distribution of S (for nonsynonymous mutations) for simulated data when the fitnesses are sampled from a bimodal distribution. The true distribution is shown as vertical shaded bars. The distributions are calculated as in Figure 2.
Figure 4
Figure 4
Kullback–Leibler divergence between the true distribution of S (for nonsynonymous mutations) and its estimate vs. number of taxa for simulated data sets.
Figure 5
Figure 5
Kullback–Leibler divergence between the true distribution of S (for nonsynonymous mutations) and its estimate as a function of total tree height of a 4096-taxon tree.
Figure 6
Figure 6
Estimated distribution of S (for nonsynonymous mutations) for real data sets. The DKL distance is calculated with Equation 12, with h0 being the weaker penalty. The distributions are calculated using Equation 4, setting wI = 0.25 for all I.

References

    1. Akashi H., 1999. Within- and between-species DNA sequence variation and the ‘footprint’ of natural selection. Gene 238: 39–51. - PubMed
    1. Ashenberg O., Gong L. I., Bloom J. D., 2013. Mutational effects on stability are largely conserved during protein evolution. Proc. Natl. Acad. Sci. USA 110: 21071–21076. - PMC - PubMed
    1. Bartlett G. J., Porter C. T., Borkakoti N., Thornton J. M., 2002. Analysis of catalytic residues in enzyme active sites. J. Mol. Biol. 324: 105–121. - PubMed
    1. Baud F., Karlin S., 1999. Measures of residue density in protein structures. Proc. Natl. Acad. Sci. USA 96: 12494–12499. - PMC - PubMed
    1. Boivin S., Cusack S., Ruigrok R. W., Hart D. J., 2010. Influenza A virus polymerase: structural insights into replication and host adaptation mechanisms. J. Biol. Chem. 285: 28411–28417. - PMC - PubMed

Publication types

LinkOut - more resources