. 2014 Mar 28;289(13):9158-71.
doi: 10.1074/jbc.M113.531202. Epub 2014 Feb 15.

Lysosomes integrate metabolic-inflammatory cross-talk in primary macrophage inflammasome activation

Affiliations

Lysosomes integrate metabolic-inflammatory cross-talk in primary macrophage inflammasome activation

Kassandra Weber et al. J Biol Chem. .

Abstract

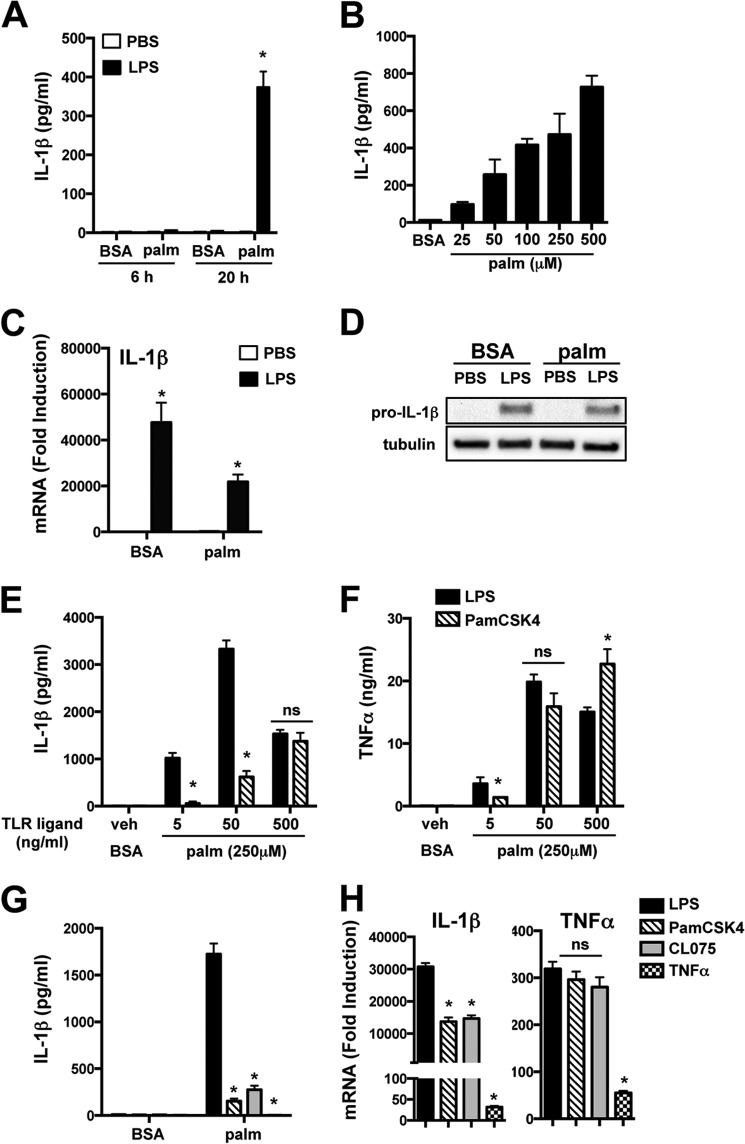
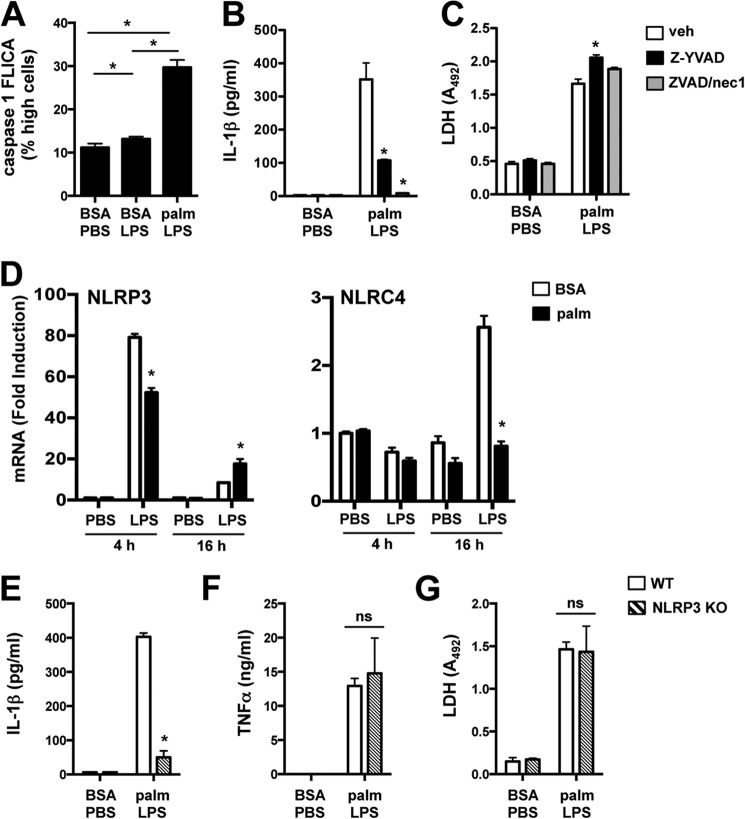
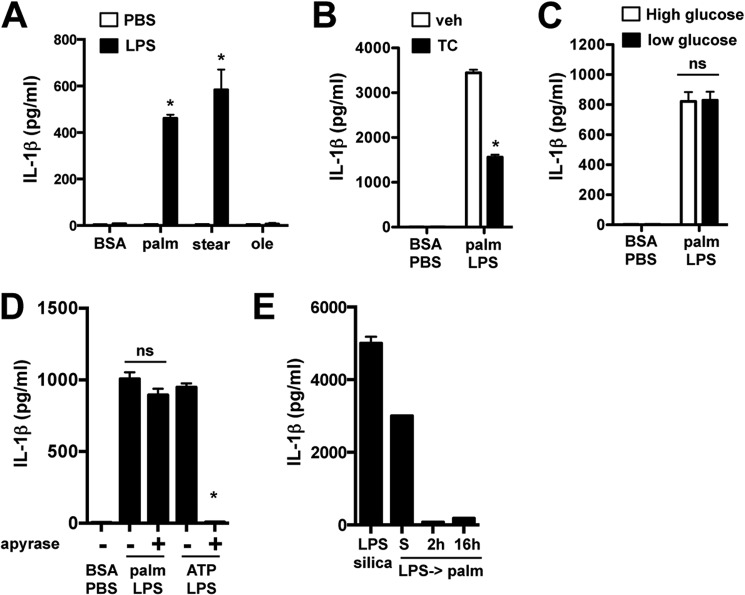
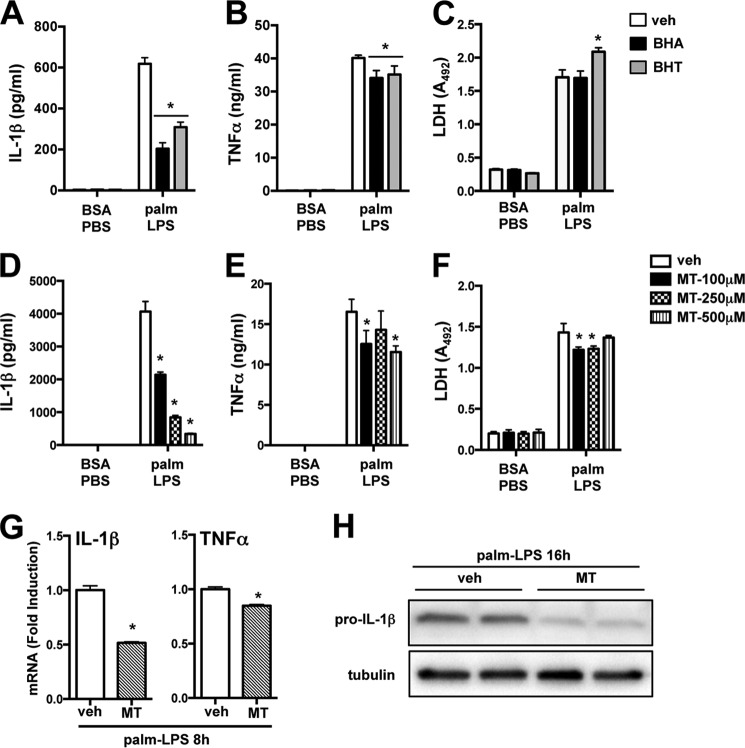
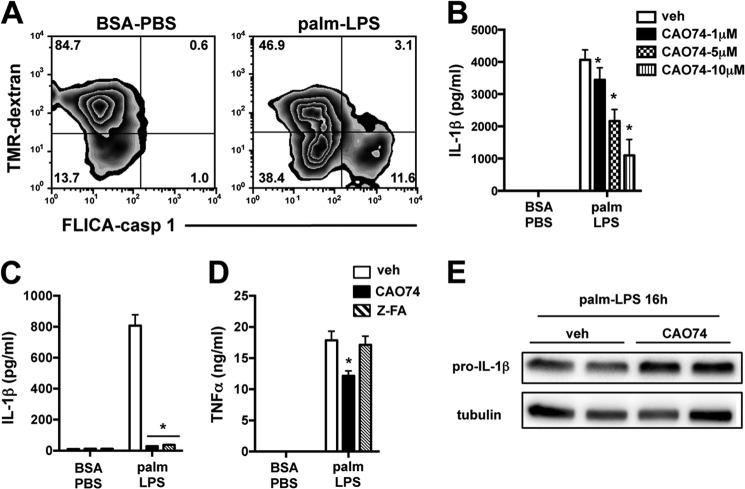
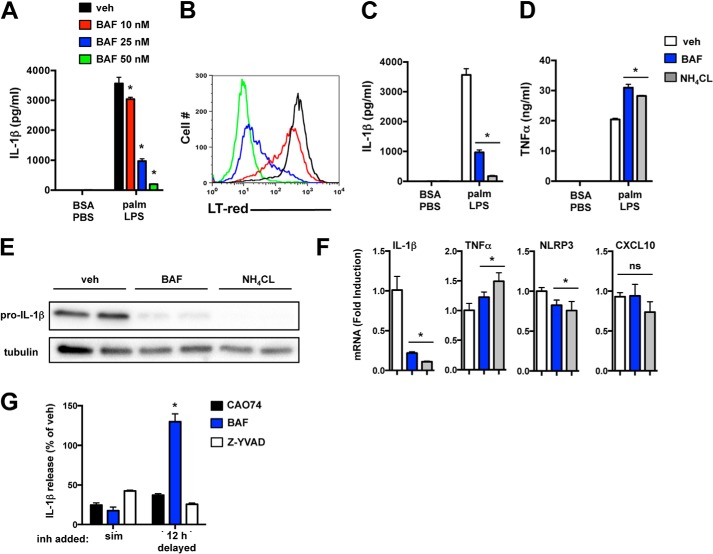
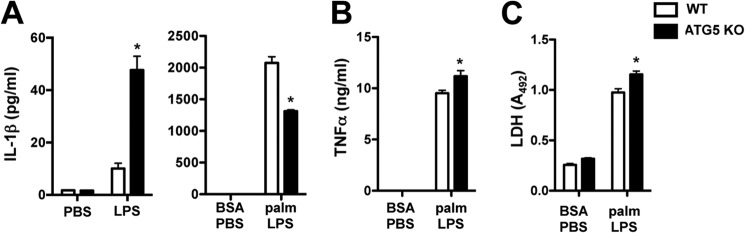
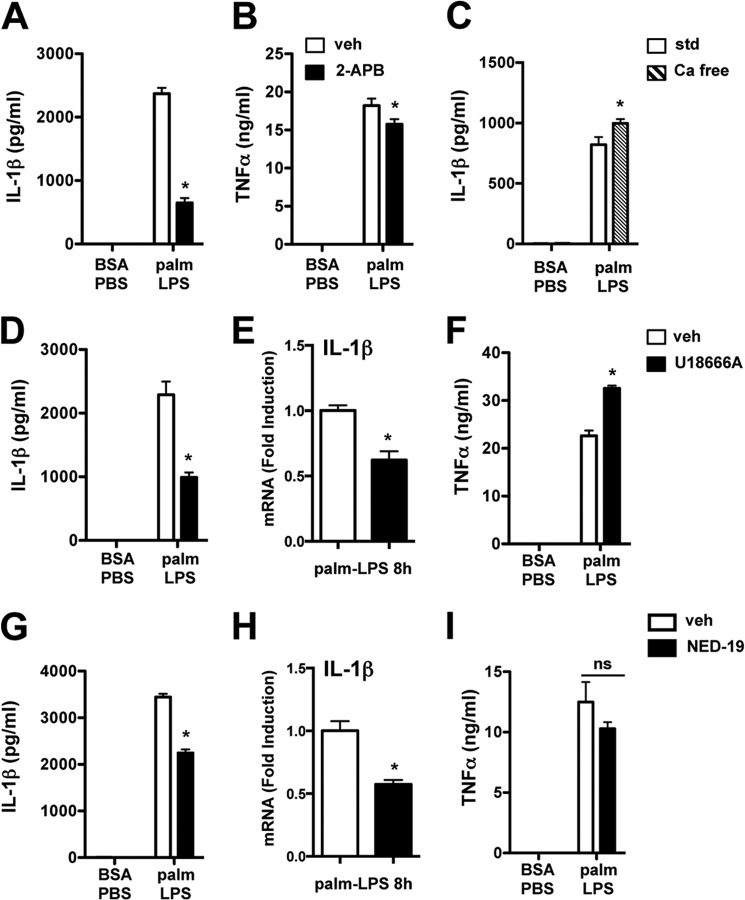
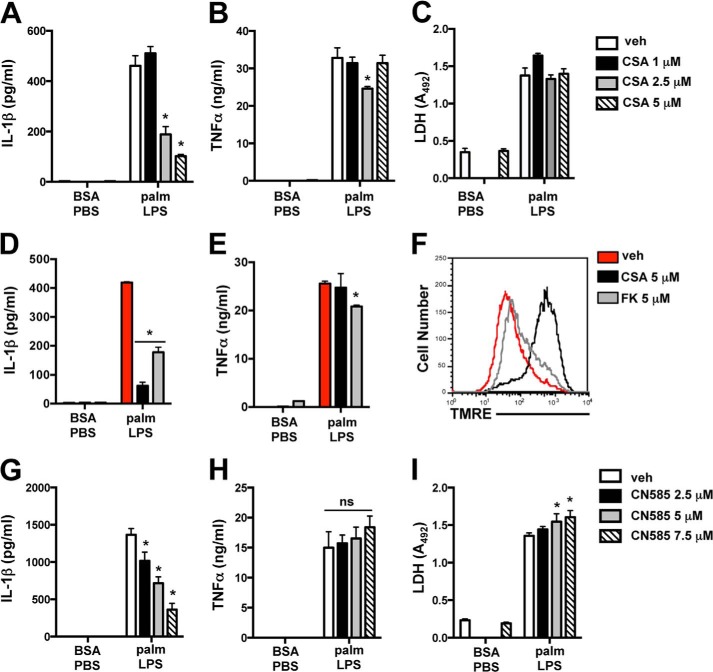
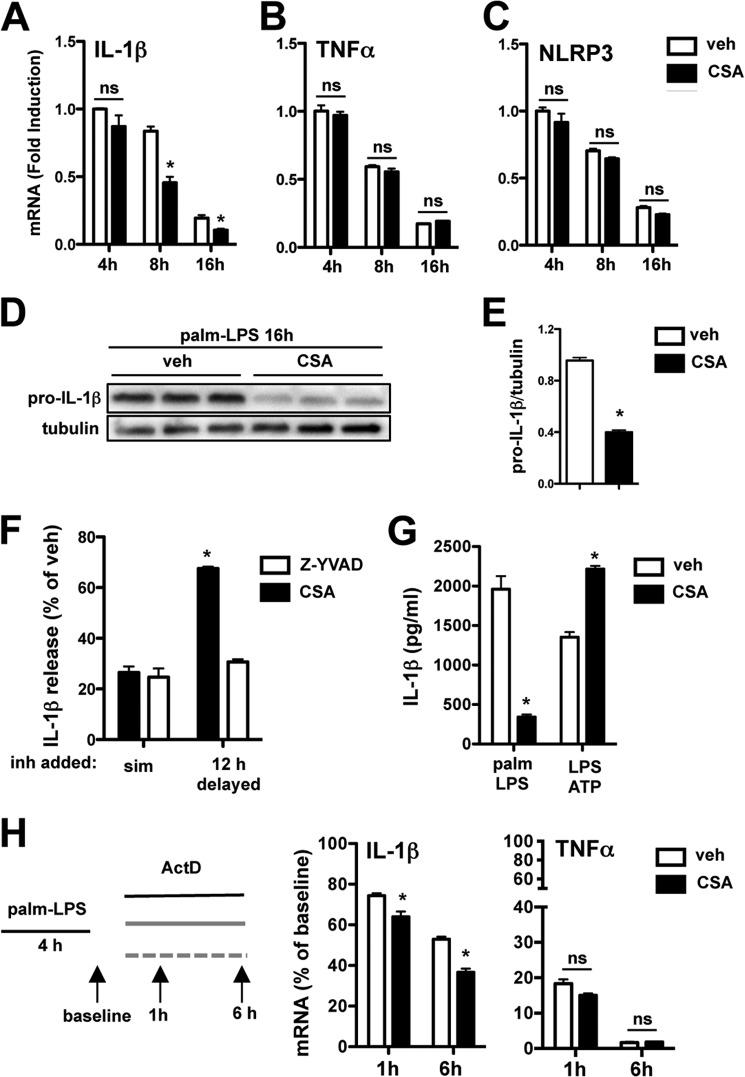
Macrophage dysfunction and inflammasome activation have been implicated in the pathogenesis of diabetes and its complications. Prolonged inflammation and impaired healing are hallmarks of the diabetic response to tissue injury, and excessive inflammasome activation has been associated in these phenotypes. However, the mechanisms that regulate the inflammasome in response to lipid metabolic and inflammatory stress are incompletely understood. We have shown previously that IL-1β secretion is induced in primary macrophages exposed to the dietary saturated fatty acid palmitate in combination with LPS. In this study, we sought to unravel the mechanisms underlying the activation of this lipotoxic inflammasome. We demonstrate that palmitate-loaded primary macrophages challenged with LPS activate the NLRP3 inflammasome through a mechanism that involves the lysosome. Interestingly, the lysosome was involved in both the regulation of pro-IL-1β levels and its subsequent cleavage/release. The lysosomal protease cathepsin B was required for IL-1β release but not pro-IL-1β production. In contrast, disrupting lysosomal calcium regulation decreased IL-1β release by reducing pro-IL-1β levels. The calcium pathway involved the calcium-activated phosphatase calcineurin, which stabilized IL-1β mRNA. Our findings provide evidence that the lysosome plays a key role in both the priming and assembly phases of the lipostoxic inflammasome. These findings have potential relevance to the hyperinflammatory phenotypes observed in diabetics during tissue damage or infection and identify lysosomes and calcineurin as potential therapeutic targets.

Keywords: Calcineurin; Diabetes; Inflammation; Lipids; Lysosomes; Macrophages.


Figures

FIGURE 1.
FIGURE 1.
Palmitate and LPS activate the lipotoxic inflammasome in primary macrophages. A, pMACs were preloaded with 250 μm palmitate (palm) or with BSA for 2 h followed by BSA or palmitate ± 50 ng/ml LPS for the indicated times, and IL-1β in the supernatant was quantified by ELISA. B, pMACs were incubated with BSA or the indicated concentrations of palmitate in combination with LPS and IL-1β release at 20 h was determined by ELISA. C, macrophages were stimulated as indicated for 4 h, and IL-1β mRNA was quantified by qRT-PCR. D, pMACs were stimulated as indicated for 16 h, and pro-IL-1β protein was assessed by Western blotting. E and F, pMACs were stimulated with the indicated doses of LPS or PamCSK4 (TLR2 ligand) with BSA or palmitate, and IL-1β (E) or TNFα (F) release was quantified at 20 h. G and H, IL-1β release at 20 h and IL-1β and TNF mRNA levels at 4 h were determined after stimulation with LPS (black bars), PamCSK4 (50 ng/ml, hatched bars), CL075 (TLR7 ligand, 500 ng/ml, gray bars), or TNFα (50 ng/ml, hatched bars) with BSA or palmitate. Bar graphs indicate the means ± S.E. for a minimum of three experiments, each performed in triplicate. *, p < 0.05 for BSA-PBS versus palmitate-LPS or LPS versus other TLR agonists.
FIGURE 2.
FIGURE 2.
Activation of the lipotoxic inflammasome occurs via a NLRP3-dependent mechanism. A, pMACs were stimulated with BSA-PBS, BSA-LPS, or palmitate (palm)-LPS for 16 h, and caspase-1 activation was determined by staining cells with caspase-1 FLICA reagent followed by quantification of FL1 high fluorescence cells by flow cytometry. B and C, macrophages were stimulated as indicated in the presence of Z-YVAD (50 μm, black bars) or Z-VAD/necrostatin 1 (nec1) (25 μm/50 μm, gray bars) for 20 h followed by quantification of IL-1β and LDH release. D, pMACs were pretreated with BSA or palmitate ± LPS for 4 or 16 h, and mRNA expression of NLRP3 and NLRC4 was determined by qRT-PCR. E–G, WT (white bars) or NLRP3 KO (hatched bars) pMACs were stimulated as indicated for 20 h, after which the release of IL-1β (E), TNFα (F), and LDH (G) was quantified. Bar graphs indicate the mean ± S.E. for a minimum of three experiments, each performed in triplicate. *, p < 0.05 for BSA versus palmitate, WT versus KO, or vehicle (veh) versus inhibitor.
FIGURE 3.
FIGURE 3.
Lipotoxic inflammasome activation requires saturated fatty acids independently of high glucose or ATP. A–C, IL-1β concentration in the media was determined 20 h after stimulation of pMACs with the indicated FFA (stearate (stear) or oleate (ole) (A)), in the presence or absence of 1 μm triascin C (TC (B)), or in high (4.5 g/liter) or low (1g/liter) glucose medium (C). D, macrophages were treated with palmitate (palm)-LPS for 20 h ± apyrase or primed with LPS for 2 h followed by 5 mm ATP ± apyrase for 60 min, and IL-1β release was quantified by ELISA. E, pMACs were treated with palmitate-LPS simultaneously (S) or pretreated with LPS for the indicated times followed by palmitate incubation for 20 h. As a control, the cells were also treated with LPS for 2 h followed by silica (200 μg/ml) for 6 h. IL-1β concentration in the supernatant was determined by ELISA. Bar graphs indicate the means ± S.E. for a minimum of three experiments, each performed in triplicate. *, p < 0.05 for BSA-PBS versus FFA-LPS, or vehicle (veh) versus inhibitor. ns, not significant.
FIGURE 4.
FIGURE 4.
Mitochondrial ROS primes the lipotoxic inflammasome. A–F, macrophages were stimulated for 20 h with BSA-PBS or palmitate (palm)-LPS ± the general antioxidants BHA (50 μm, black bars) or BHT (50 μm, gray bars) (A–C) or the indicated doses of the mitochondria-specific ROS scavenger mito-TEMPO (MT, hatched bars) (D–F), and the release of IL-1β (A and D), TNFα (B and E), and LDH (C and F) was determined. G, pMACs were treated with palmitate-LPS ± mito-TEMPO for 8 h, and IL-1β or TNFα mRNA was quantified by qRT-PCR. H, macrophages were incubated with palmitate-LPS for 16 h ± mito-TEMPO (500 μm) after which intracellular pro-IL-1β levels were assessed by Western blotting. Tubulin was used as a loading control. Bar graphs indicate the mean ± S.E. for a minimum of three experiments, each performed in triplicate. *, p < 0.05 for vehicle (veh) versus inhibitor.
FIGURE 5.
FIGURE 5.
The lysosome is required for lipotoxic inflammasome activation. A, pMACs were loaded with tetramethylrhodamine (TMR)-dextran to label lysosomes followed by stimulation with BSA-PBS or palmitate (palm)-LPS for 16 h. The cells were stained with caspase-1 FLICA and analyzed by flow cytometry. The percentage of cells in each quadrant is indicated. B, the cathepsin B inhibitor CAO74 was added at the indicated doses, and IL-1β release following palmitate-LPS challenge was assessed at 20 h. C and D, macrophages were incubated with CAO74 (black bars) or another cathepsin B inhibitor, Z-FA (50 μm, hatched bars), during stimulation with BSA-PBS or palmitate-LPS for 20 h. IL-1β (C) and TNFα (D) concentrations in the supernatant were determined by ELISA. E, pro-IL-1β levels in palmitate-LPS-treated pMACs ± CAO74 (10 μm) were determined at 16 h by Western blotting. Bar graphs indicate the mean ± S.E. for a minimum of three experiments, each performed in triplicate. *, p < 0.05 for vehicle (veh) versus inhibitor. ns, not significant.
FIGURE 6.
FIGURE 6.
Lysosomal acidification inhibitors block pro-IL-1β synthesis. A and B, pMACs were treated with palmitate (palm)-LPS, and the indicated concentrations of BAF after which IL-1β release (A) or LysoTracker Red (LT-red) staining (B) were assessed by ELISA and flow cytometry, respectively. C and D, the lysosome acidification inhibitors BAF (25 nm, blue bars) or NH4CL (5 mm, gray bars) were added to treated macrophages, and IL-1β (C) or TNFα (D) release was quantified. E, pro-IL-1β protein levels were determined in pMACs treated with palmitate-LPS ± BAF or NH4CL at 16 h by Western blotting. F, pMACs were treated with palmitate-LPS for 8 h in the presence of vehicle (veh, white bars), BAF (blue bars), or NH4CL (gray bars), and mRNA expression of IL-1β, TNFα, NLRP3, and CXCL10 was determined by qRT-PCR. G, palmitate-LPS-treated pMACs were incubated with vehicle, CAO74 (black bars), BAF (blue bars), or Z-YVAD (white bars) either simultaneous with the stimulation (sim) or delayed by 12 h. IL-1β release was quantified by ELISA, and the levels are reported as percent vehicle (where 100% means no inhibition). Bar graphs indicate the mean ± S.E. for a minimum of three experiments, each performed in triplicate. *, p < 0.05 for vehicle versus inhibitor.
FIGURE 7.
FIGURE 7.
Loss of the autophagy protein ATG5 reduces IL-1β release in response to lipotoxic stress. A, IL-1β release was determined in pMACs from myeloid-specific ATG5-deficient animals (ATG5 KO, black bars) or WT littermate controls (white bars) that were treated with PBS versus LPS (left panel) or BSA-PBS versus palmitate (palm)-LPS (right panel) for 20 h. B and C, the release of TNFα and LDH was quantified in WT versus ATG5 KO macrophages. Bar graphs indicate the mean ± S.E. for a minimum of three experiments, each performed in triplicate. *, p < 0.05 for WT versus KO.
FIGURE 8.
FIGURE 8.
Intracellular calcium stores are required for full activation of the lipotoxic inflammasome. A and B, pMACs were stimulated as indicated in the presence of vehicle (veh, white bars) or 2-APB (100 μm, black bars) for 20 h after which IL-1β (A) and TNFα (B) release was quantified. C, cells were treated with the indicated stimuli in standard medium (std, white bars) or calcium-free DMEM (Ca free, hatched bars), and IL-1β release was assessed at 20 h by ELISA. D–F, stimulated macrophages were incubated with vehicle (white bars) versus U18666A (1 μg/ml, black bars), and IL-1β secretion (D), 8-h IL-1β mRNA (E), and TNFα release (F) were quantified. G–I, pMACs were stimulated as indicated in the presence of vehicle (white bars) or NED-19 (100 μm, black bars), and IL-1β secretion (G), 8-h IL-1β mRNA (H), and TNFα release (I) were determined. Bar graphs indicate the mean ± S.E. for a minimum of three experiments, each performed in triplicate. *, p < 0.05 for vehicle versus inhibitor. palm, palmitate. ns, not significant.
FIGURE 9.
FIGURE 9.
Calcineurin inhibitors suppress IL-1β release during activation of the lipotoxic inflammasome. A–C, stimulated macrophages were incubated with the indicated concentrations of CSA, and IL-1β (A), TNFα (B), and LDH release (C) were quantified 20 h later. D and E, pMACs were incubated with vehicle (veh, red bars), CSA (black bars), or FK506 (FK, gray bars) during 20 h of stimulation with BSA-PBS or palmitate (palm)-LPS after which IL-1β (D) and TNFα (E) concentrations in the supernatant were determined by ELISA. F, mitochondrial membrane potential was assessed by tetramethylrhodamine ethyl ester (TMRE) staining followed by flow cytometry in pMACs incubated with vehicle (red line), CSA (black line), or FK506 (gray line) for 20 h. G–I, macrophages were stimulated in the presence of the indicated concentrations of CN585, and IL-1β (G), TNFα (H), and LDH release (I) were quantified 20 h later. Bar graphs indicate the mean ± S.E. for a minimum of three experiments, each performed in triplicate. *, p < 0.05 for vehicle versus inhibitor. ns, not significant.
FIGURE 10.
FIGURE 10.
Inhibition of calcineurin reduces IL-1β mRNA stability and protein levels in response to lipotoxic stimulation. A–C, pMACs were stimulated with palmitate-LPS ± 5 μm CSA, and mRNA expression of IL-1β (A), TNFα (B), and NLRP3 (C) was assessed at the indicated time points by qRT-PCR. D, the expression of pro-IL-1β protein was determined by Western blotting from macrophages stimulated with palmitate (palm)-LPS for 16 h in the presence of vehicle (veh) or CSA. E, quantification of pro-IL-1β protein expression normalized to tubulin. F, pMACs were activated with palmitate-LPS, and vehicle, CSA, or Z-YVAD (50 μm) was added simultaneously with the stimulation (sim) or delayed by 12 h. IL-1β release was quantified by ELISA, and the levels are reported as % vehicle (where 100% means no inhibition). G, macrophages were treated with palmitate-LPS ± CSA or pretreated with LPS (for 2 h) followed by 5 mm ATP ± CSA for 60 min. IL-1β release was quantified by ELISA. H, pMACs were treated with palmitate-LPS for 4 h after which actinomycin D (ActD, 5 μm) was added to the cells in the presence (black bars) or absence (white bars) of CSA (5 μm). IL-1β and TNFα mRNA levels were quantified at the indicated time points by qRT-PCR. Bar graphs indicate the mean ± S.E. for a minimum of three experiments, each performed in triplicate. *, p < 0.05 for vehicle versus inhibitor or early versus delayed stimulations.

References

    1. Schilling J. D., Machkovech H. M., He L., Diwan A., Schaffer J. E. (2013) TLR4 activation under lipotoxic conditions leads to synergistic macrophage cell death through a TRIF-dependent pathway. J. Immunol. 190, 1285–1296 - PMC - PubMed
    1. Schilling J. D., Machkovech H. M., He L., Sidhu R., Fujiwara H., Weber K., Ory D. S., Schaffer J. E. (2013) Palmitate and lipopolysaccharide trigger synergistic ceramide production in primary macrophages. J. Biol. Chem. 288, 2923–2932 - PMC - PubMed
    1. Khanna S., Biswas S., Shang Y., Collard E., Azad A., Kauh C., Bhasker V., Gordillo G. M., Sen C. K., Roy S. (2010) Macrophage dysfunction impairs resolution of inflammation in the wounds of diabetic mice. PLoS One 5, e9539. - PMC - PubMed
    1. Mirza R., Koh T. J. (2011) Dysregulation of monocyte/macrophage phenotype in wounds of diabetic mice. Cytokine 56, 256–264 - PubMed
    1. Kanter J. E., Kramer F., Barnhart S., Averill M. M., Vivekanandan-Giri A., Vickery T., Li L. O., Becker L., Yuan W., Chait A., Braun K. R., Potter-Perigo S., Sanda S., Wight T. N., Pennathur S., Serhan C. N., Heinecke J. W., Coleman R. A., Bornfeldt K. E. (2012) Diabetes promotes an inflammatory macrophage phenotype and atherosclerosis through acyl-CoA synthetase 1. Proc. Natl. Acad. Sci. U.S.A. 109, E715–E724 - PMC - PubMed

Publication types

MeSH terms

LinkOut - more resources