

A randomized clinical trial testing the anti-inflammatory effects of preemptive inhaled nitric oxide in human liver transplantation
- PMID: 24533048
- PMCID: PMC3922702
- DOI: 10.1371/journal.pone.0086053
A randomized clinical trial testing the anti-inflammatory effects of preemptive inhaled nitric oxide in human liver transplantation
Abstract
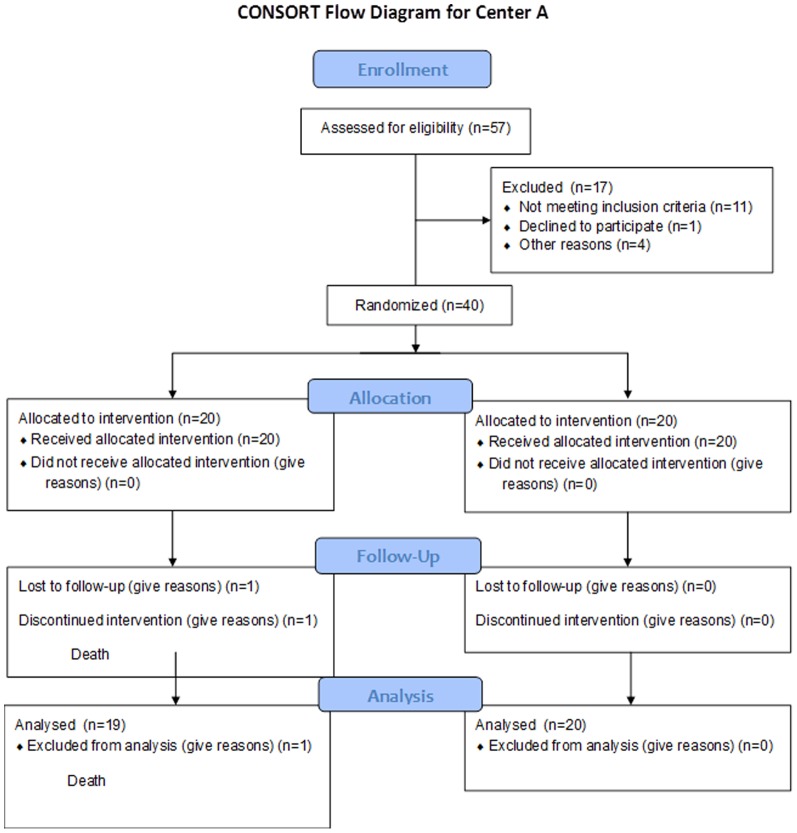
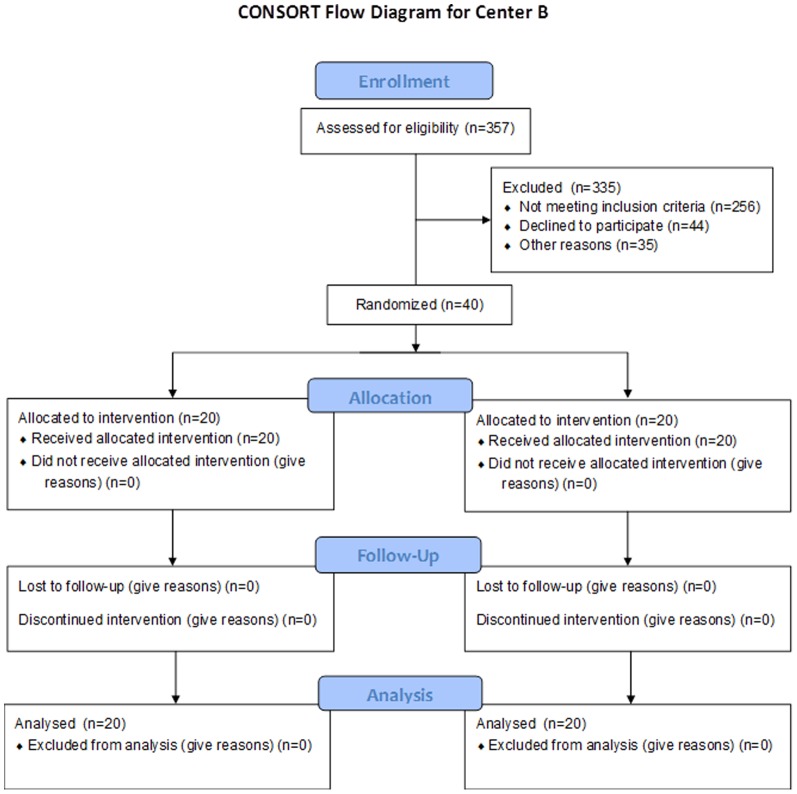
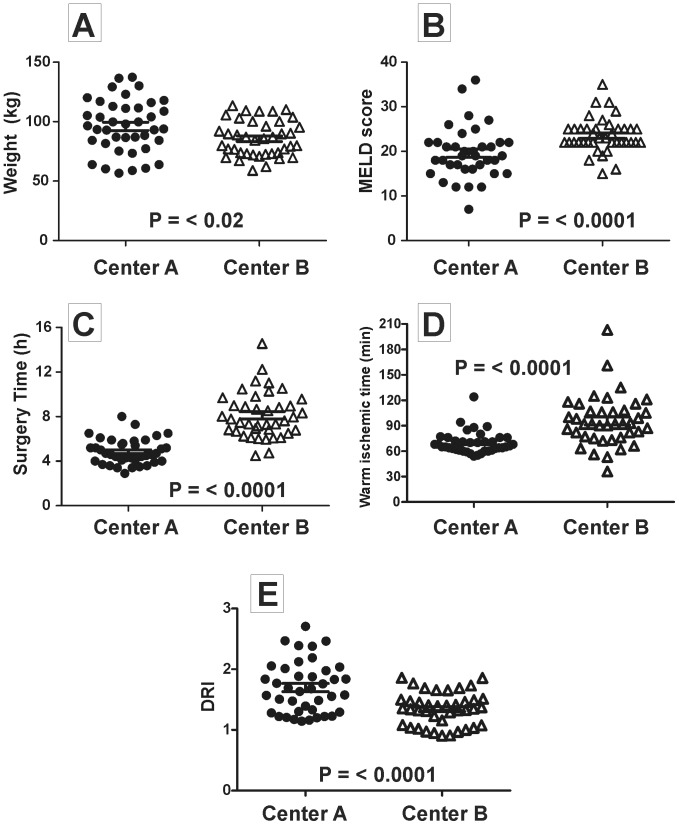
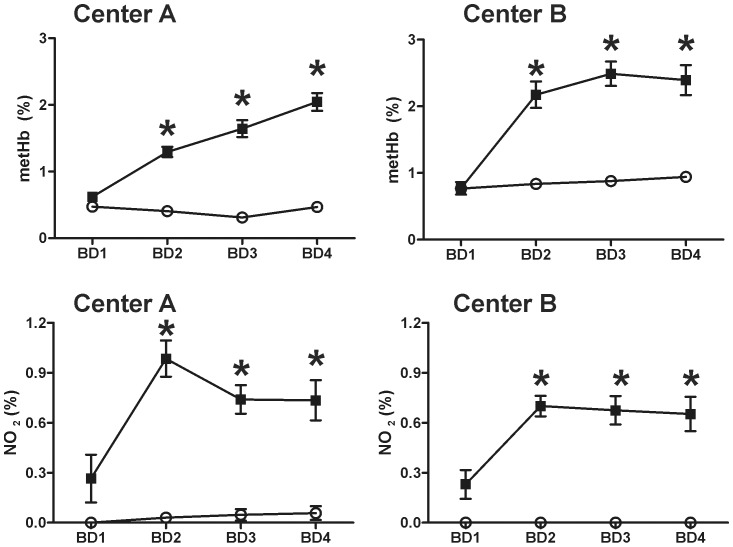
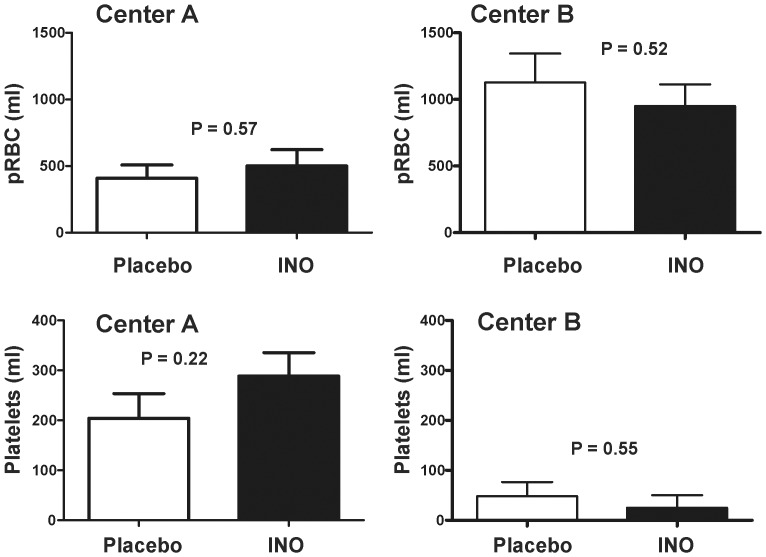
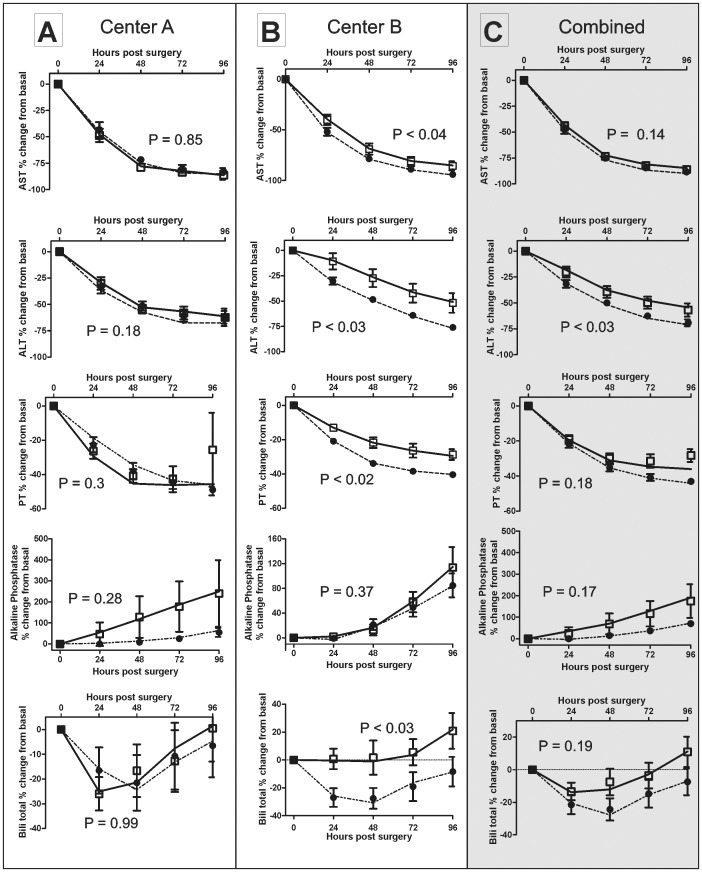
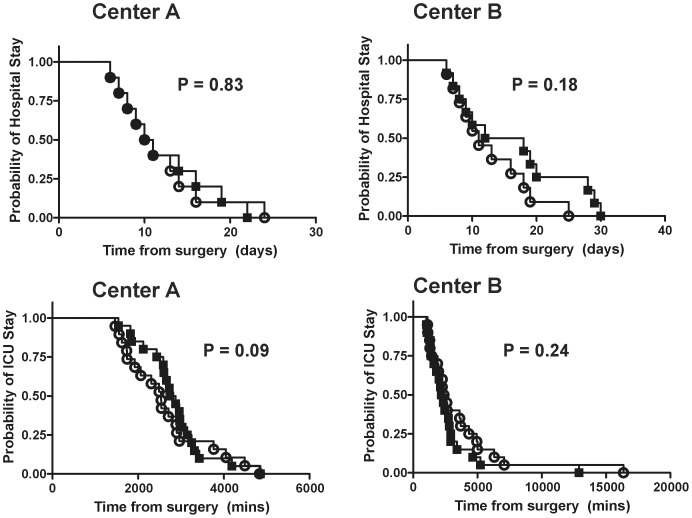
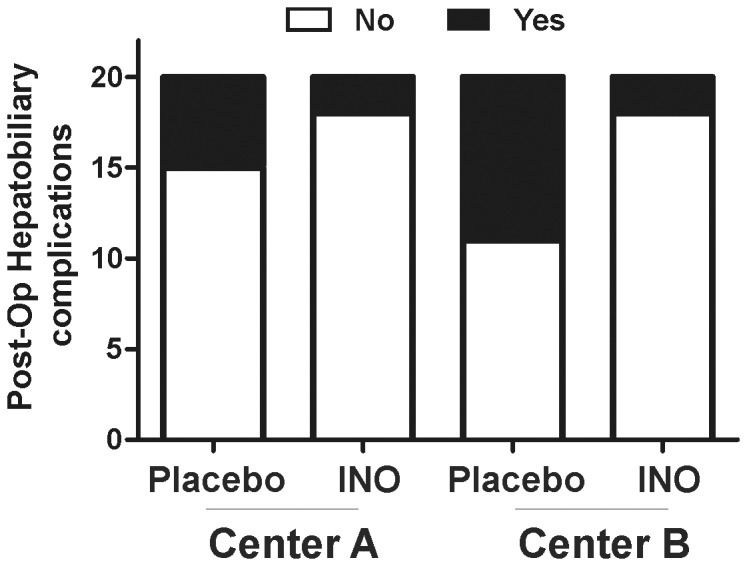
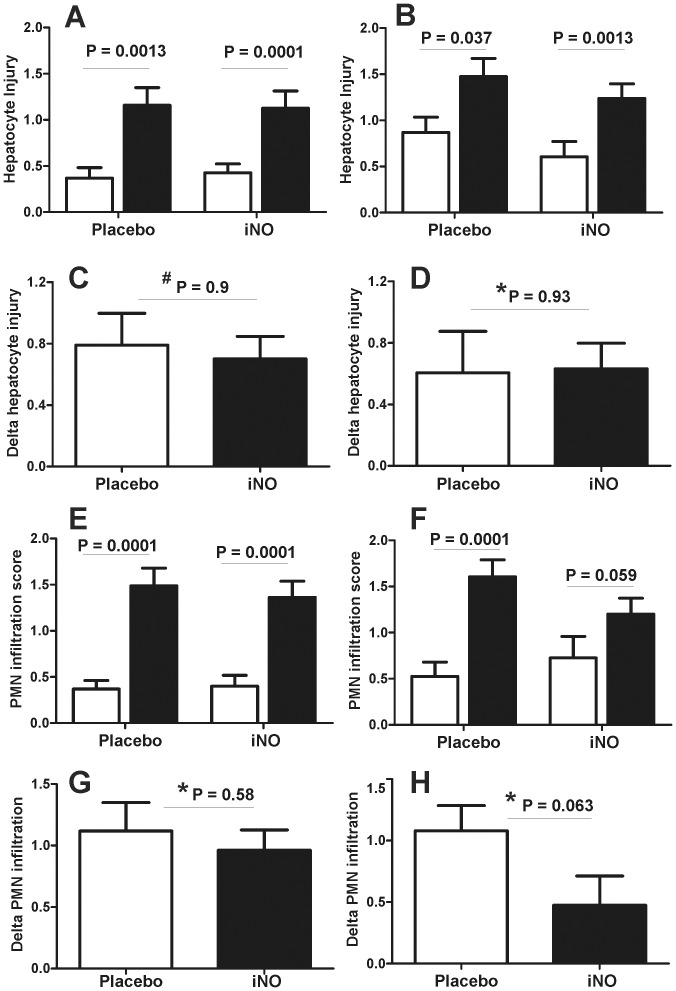
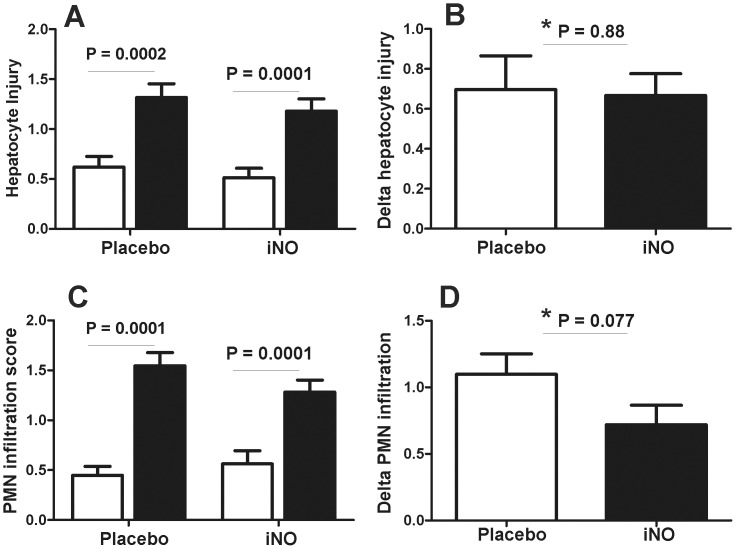
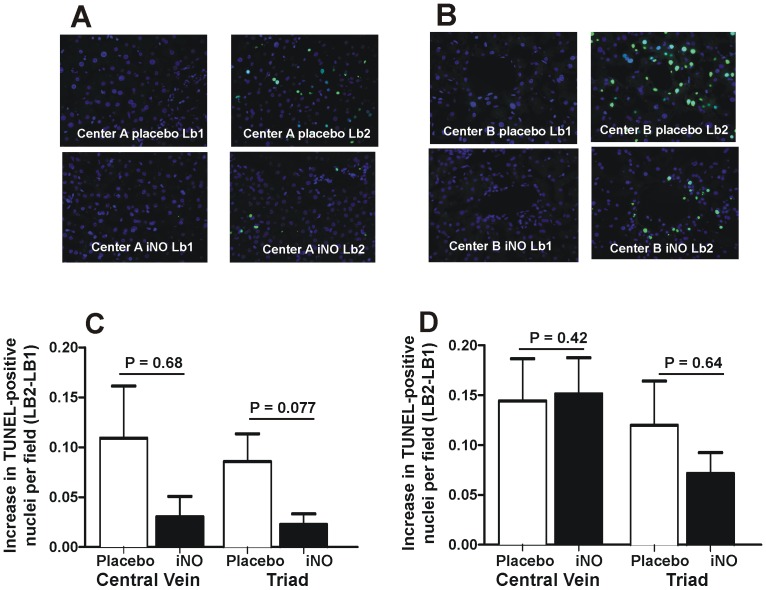
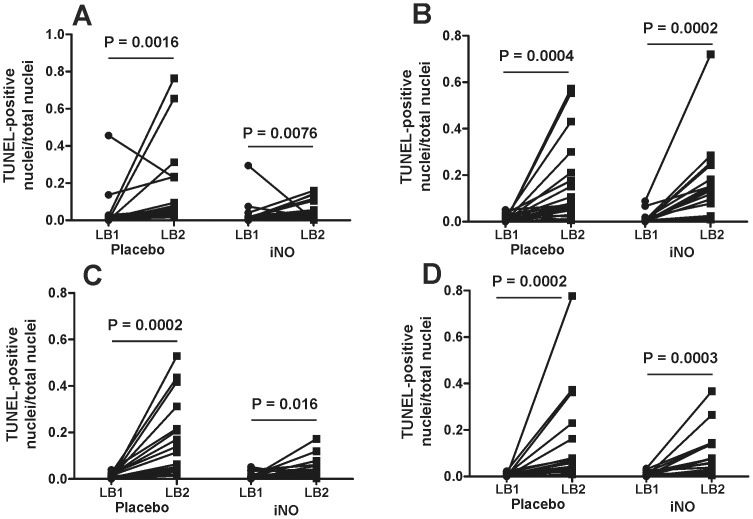
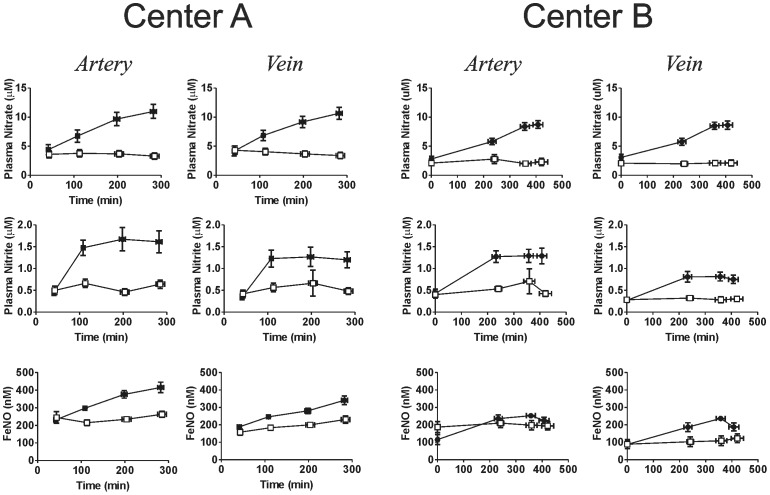
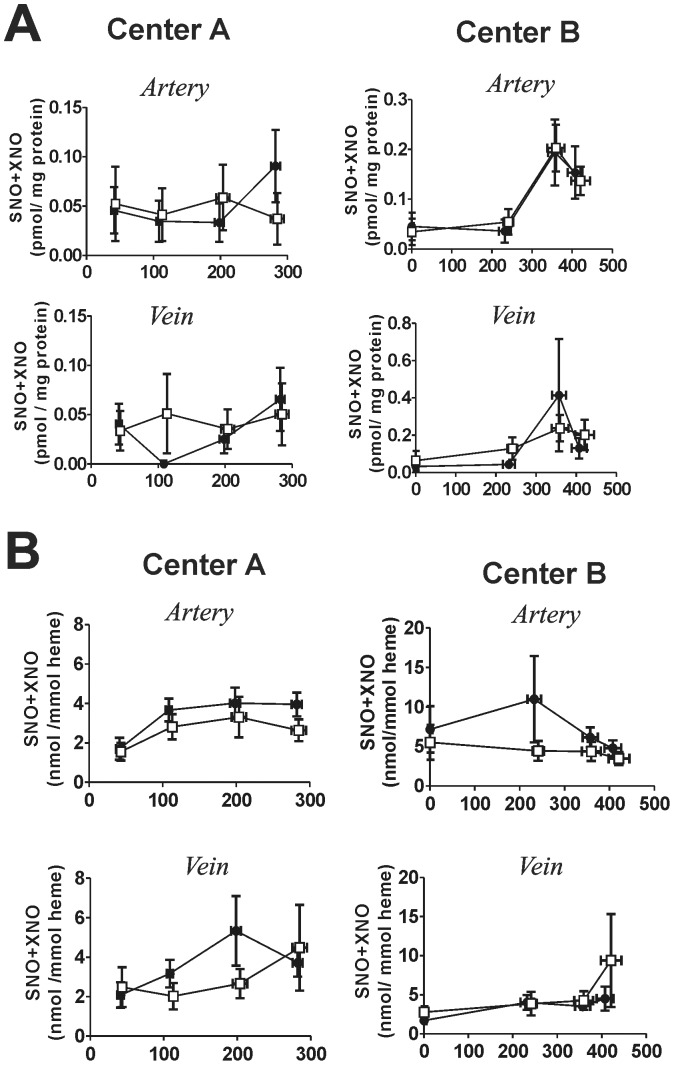
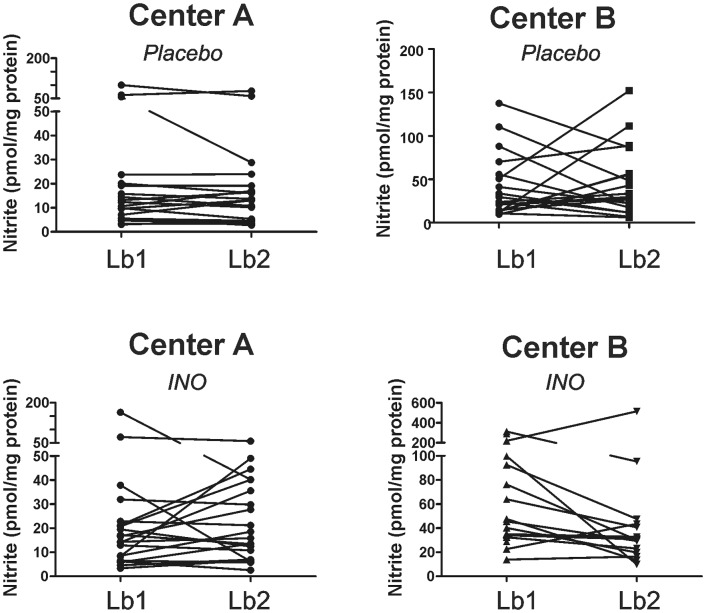
Decreases in endothelial nitric oxide synthase derived nitric oxide (NO) production during liver transplantation promotes injury. We hypothesized that preemptive inhaled NO (iNO) would improve allograft function (primary) and reduce complications post-transplantation (secondary). Patients at two university centers (Center A and B) were randomized to receive placebo (n = 20/center) or iNO (80 ppm, n = 20/center) during the operative phase of liver transplantation. Data were analyzed at set intervals for up to 9-months post-transplantation and compared between groups. Patient characteristics and outcomes were examined with the Mann-Whitney U test, Student t-test, logistic regression, repeated measures ANOVA, and Cox proportional hazards models. Combined and site stratified analyses were performed. MELD scores were significantly higher at Center B (22.5 vs. 19.5, p<0.0001), surgical times were greater at Center B (7.7 vs. 4.5 hrs, p<0.001) and warm ischemia times were greater at Center B (95.4 vs. 69.7 min, p<0.0001). No adverse metabolic or hematologic effects from iNO occurred. iNO enhanced allograft function indexed by liver function tests (Center B, p<0.05; and p<0.03 for ALT with center data combined) and reduced complications at 9-months (Center A and B, p = 0.0062, OR = 0.15, 95% CI (0.04, 0.59)). ICU (p = 0.47) and hospital length of stay (p = 0.49) were not decreased. iNO increased concentrations of nitrate (p<0.001), nitrite (p<0.001) and nitrosylhemoglobin (p<0.001), with nitrite being postulated as a protective mechanism. Mean costs of iNO were $1,020 per transplant. iNO was safe and improved allograft function at one center and trended toward improving allograft function at the other. ClinicalTrials.gov with registry number 00582010 and the following URL:http://clinicaltrials.gov/show/NCT00582010.
Conflict of interest statement
Figures
Similar articles
-
Practice Variation, Costs and Outcomes Associated with the Use of Inhaled Nitric Oxide in Pediatric Heart Transplant Recipients.Pediatr Cardiol. 2019 Mar;40(3):650-657. doi: 10.1007/s00246-018-2042-1. Epub 2018 Dec 13. Pediatr Cardiol. 2019. PMID: 30547294 Free PMC article.
-
Inhaled NO accelerates restoration of liver function in adults following orthotopic liver transplantation.J Clin Invest. 2007 Sep;117(9):2583-91. doi: 10.1172/JCI31892. J Clin Invest. 2007. PMID: 17717604 Free PMC article. Clinical Trial.
-
Inhaled Pulmonary Vasodilator Therapy in Adult Lung Transplant: A Randomized Clinical Trial.JAMA Surg. 2022 Jan 1;157(1):e215856. doi: 10.1001/jamasurg.2021.5856. Epub 2022 Jan 12. JAMA Surg. 2022. PMID: 34787647 Free PMC article. Clinical Trial.
-
Effects of inhaled nitric oxide following lung transplantation.J Card Surg. 2009 May-Jun;24(3):269-74. doi: 10.1111/j.1540-8191.2009.00833.x. J Card Surg. 2009. PMID: 19438780
-
Inhaled nitric oxide in preterm infants.Evid Rep Technol Assess (Full Rep). 2010 Oct;(195):1-315. Evid Rep Technol Assess (Full Rep). 2010. PMID: 23126546 Free PMC article. Review.
Cited by
-
Nitric oxide signalling and neuronal nitric oxide synthase in the heart under stress.F1000Res. 2017 May 23;6:742. doi: 10.12688/f1000research.10128.1. eCollection 2017. F1000Res. 2017. PMID: 28649367 Free PMC article. Review.
-
Association of over-the-counter mouthwash use with markers of nitric oxide metabolism, inflammation, and endothelial function-a cross-sectional study.Front Oral Health. 2025 Jan 27;6:1488286. doi: 10.3389/froh.2025.1488286. eCollection 2025. Front Oral Health. 2025. PMID: 39981124 Free PMC article.
-
Working with nitric oxide and hydrogen sulfide in biological systems.Am J Physiol Lung Cell Mol Physiol. 2015 Mar 1;308(5):L403-15. doi: 10.1152/ajplung.00327.2014. Epub 2014 Dec 30. Am J Physiol Lung Cell Mol Physiol. 2015. PMID: 25550314 Free PMC article. Review.
-
Nitrite, a novel method to decrease ischemia/reperfusion injury in the rat liver.World J Gastroenterol. 2015 Feb 14;21(6):1775-83. doi: 10.3748/wjg.v21.i6.1775. World J Gastroenterol. 2015. PMID: 25684942 Free PMC article.
-
Biosilica nanoparticulate scavengers for the therapy of hepatic ischemia-reperfusion injury in preclinical models.Nat Commun. 2025 Aug 16;16(1):7650. doi: 10.1038/s41467-025-62968-4. Nat Commun. 2025. PMID: 40819125 Free PMC article.
References
-
- Washburn WK, Meo NA, Halff GA, Roberts JP, Feng S (2009) Factors influencing liver transplant length of stay at two large-volume transplant centers. Liver transplantation : official publication of the American Association for the Study of Liver Diseases and the International Liver Transplantation Society 15: 1570–1578. - PubMed
-
- Thuluvath PJ, Guidinger MK, Fung JJ, Johnson LB, Rayhill SC, et al. (2010) Liver transplantation in the United States, 1999–2008. American journal of transplantation : official journal of the American Society of Transplantation and the American Society of Transplant Surgeons 10: 1003–1019. - PubMed
-
- de Rougemont O, Dutkowski P, Clavien PA (2010) Biological modulation of liver ischemia-reperfusion injury. Current opinion in organ transplantation 15: 183–189. - PubMed
-
- Kupiec-Weglinski JW, Busuttil RW (2005) Ischemia and reperfusion injury in liver transplantation. Transplantation proceedings 37: 1653–1656. - PubMed
-
- Koken T, Inal M (1999) The effect of nitric oxide on ischemia-reperfusion injury in rat liver. Clinica chimica acta; international journal of clinical chemistry 288: 55–62. - PubMed
Publication types
MeSH terms
Substances
Associated data
LinkOut - more resources
Full Text Sources
Other Literature Sources
Medical
