. 2014 Feb 12;9(2):e88567.
doi: 10.1371/journal.pone.0088567. eCollection 2014.

Candidate markers associated with the probability of future pulmonary exacerbations in cystic fibrosis patients

Affiliations

Candidate markers associated with the probability of future pulmonary exacerbations in cystic fibrosis patients

Gabriella Wojewodka et al. PLoS One. .

Abstract

Introduction: Pulmonary exacerbations (PEs) cause significant morbidity and can severely impact disease progression in cystic fibrosis (CF) lung disease, especially in patients who suffer from recurrent PEs. The assessments able to predict a future PE or a recurrent PE are limited. We hypothesized that combining clinical, molecular and patient reported data could identify patients who are at risk of PE.

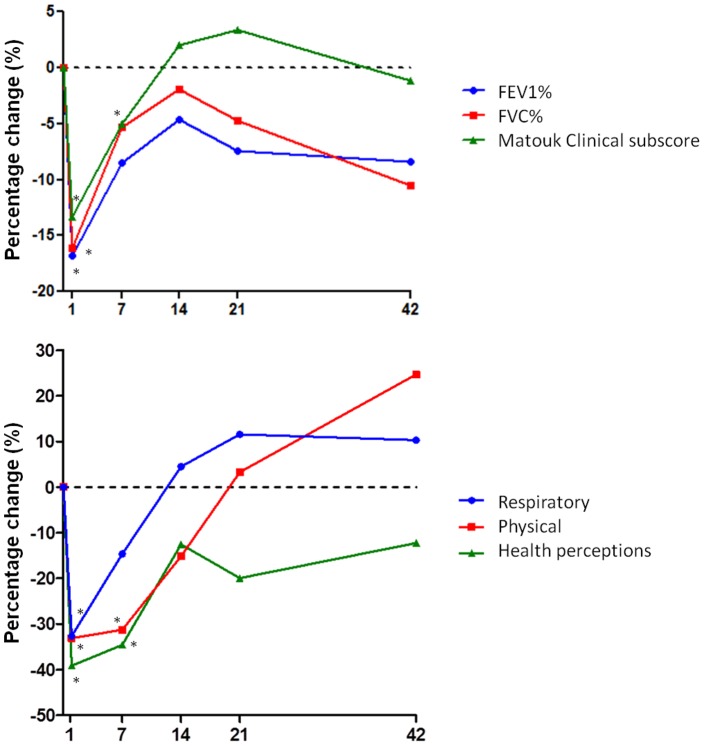
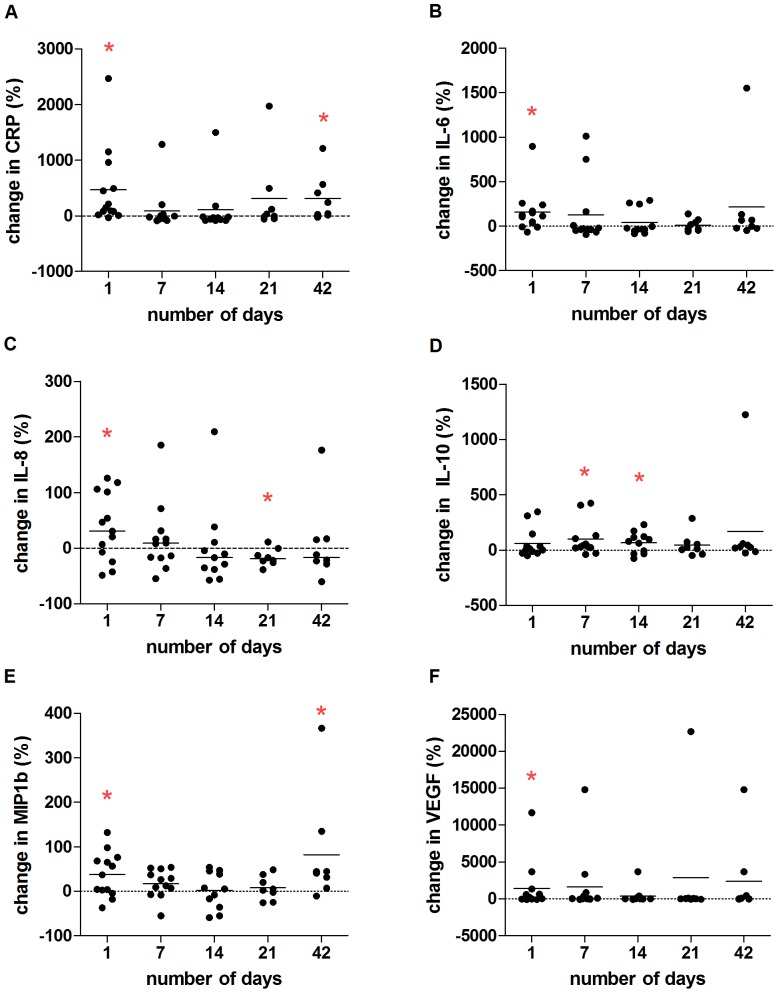
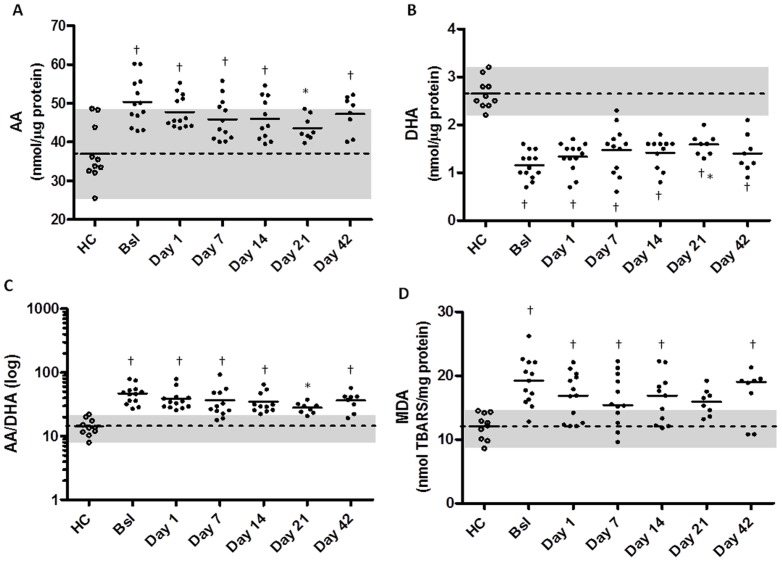
Methods: We prospectively followed a cohort of 53 adult CF patients for 24 months. Baseline values for spirometry, clinical status using the Matouk Disease Score, quality of life (QOL), inflammatory markers (C-reactive protein (CRP), interleukins (IL)-1β, -6, -8, -10, macrophage inflammatory protein (MIP)-1β, tumor necrosis factor (TNF) and vascular endothelial growth factor (VEGF)), polyunsaturated fatty acids and lipid peroxidation in blood plasma were collected for all patients during periods of stable disease, and patients were monitored for PE requiring PO/IV antibiotic treatment. Additionally, we closely followed 13 patients during PEs collecting longitudinal data on changes in markers from baseline values. We assessed whether any markers were predictors of future PE at baseline and after antibiotic treatment.

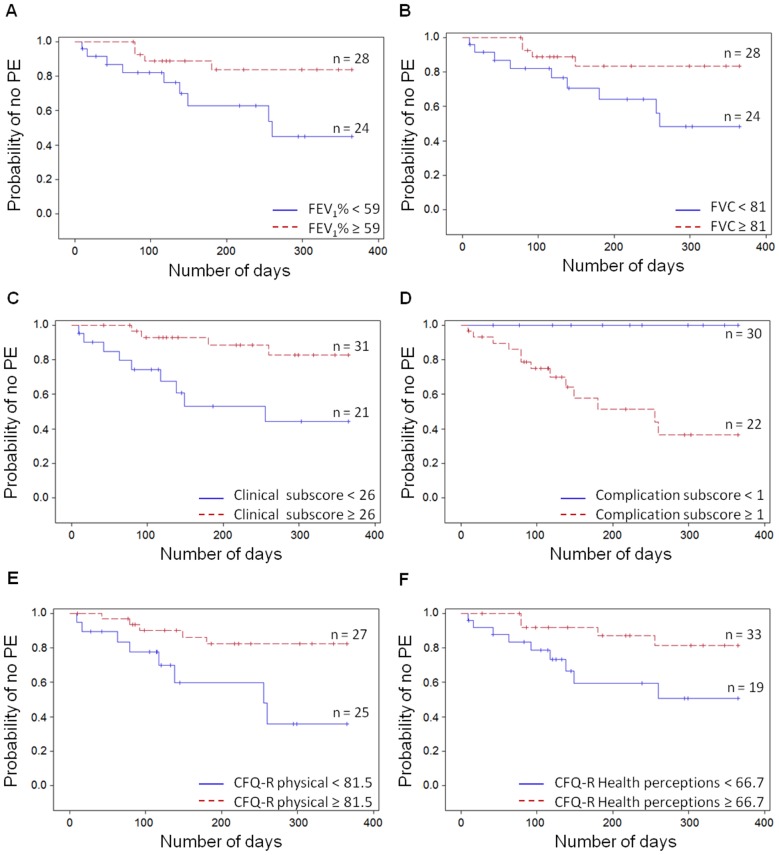
Results: Out of 53 patients, 37 experienced PEs during our study period. At baseline, we found that low lung function, clinical scoring and QOL values were associated with increased risk of PE events. PEs were associated with increased inflammatory markers at Day 1, and these biomarkers improved with treatment. The imbalance in arachidonic acid and docosahexaenoic acid levels improved with treatment which coincided with reductions in lipid peroxidation. High levels of inflammatory markers CRP and IL-8 were associated with an early re-exacerbation.

Conclusion: Our results demonstrate that worse clinical and QOL assessments during stable disease are potential markers associated with a higher risk of future PEs, while higher levels of inflammatory markers at the end of antibiotic treatment may be associated with early re-exacerbation.


Conflict of interest statement

Competing Interests: The authors have declared that no competing interests exist.

Figures

Figure 1
Figure 1. Probability of having a PE is associated with low clinical and QOL assessments.
Using the Kaplan-Meier survival analysis, we evaluated whether the markers were associated with the risk of a PE. Continuous covariates were dichotomized at the median. The parameters illustrated here were all influencing the probability of having a PE. Lower risks of PE were associated with A) higher FEV1% predicted (p = 0.020), B) higher FVC% predicted (p = 0.032), C) higher Clinical subscore of the Matouk Disease Score (p = 0.004), D) lower Complications subscore of the Matouk Disease Score (p = 0.000), E) higher assessments of QOL physical (p = 0.030) and F) higher health perceptions (p = 0.006) domains.
Figure 2
Figure 2. Percentage change of clinical and QOL parameters throughout PEs in CF.
A) FEV1% (blue, circles) and FVC% (red, squares) were significantly reduced from baseline values at Day 1 of PE (FEV1% p = 0.001; FVC% p = 0.010). Both parameters subsequently improved with treatment however, FVC% significantly declined at Day 42 (p = 0.028). The Clinical subscore of the Matouk Disease score (green, triangles) was significantly decreased from baseline values on Day 1 (p = 0.000) and Day 7 (p = 0.045). See Table S1 for the results of other Matouk Disease subscores. B) QOL items also decreased with PE onset, Day 1, such as Respiratory (blue, circles, p = 0.002), Physical (red, squares, p = 0.025) and Health Perceptions domains (green, triangles, p = 0.000). The Physical and Health Perceptions domains remained decreased at Day 7 (p = 0.025 and p = 0.001, respectively). Other QOL domains which decreased at Day 1 include: Vitality, Health Perceptions, Social and Role (Table S1). The dotted horizontal line indicates a 0% change or no change from baseline values. * indicates a significant difference from baseline. Day 1, n = 13; Day 7, n = 12, Day 14, n = 11; Day 21, n = 9; Day 42, n = 8. Full table of results can be found in Table S1.
Figure 3
Figure 3. Percentage change in inflammatory markers throughout PEs in CF.
Inflammatory markers were measured in blood plasma from CF patients throughout PE. The percentage change was calculated at each time point and compared to a 0% change which indicates no change from baseline (represented by dotted horizontal line). A) CRP levels were significantly increased from baseline values on Day 1 of PE (p = 0.001) and Day 42 (p = 0.039). B) IL-6 levels were significantly higher on Day 1 of PE (p = 0.006). C) IL-8 concentrations were significantly higher on Day 1 (p = 0.047) and significantly lower than baseline values after treatment on Day 21 (p = 0.022). D) IL-10 levels rose significantly on Days 7 (p = 0.021) and Day 14 (p = 0.046). E) MIP-1β increased from baseline on Days 1 (p = 0.020) and Day 42 (p = 0.023). F) VEGF levels were significantly higher on Day 1 of PE (p = 0.043). Solid horizontal lines are set at the mean * indicates a significant difference from 0% change from baseline. Day 1, n = 13; Day 7, n = 12, Day 14, n = 11; Day 21, n = 9; Day 42, n = 8. Full data set is found in Table S2.
Figure 4
Figure 4. The levels of PUFA and peroxidation improve with treatment for PE in CF.
PUFA concentrations were measured in blood plasma of healthy controls (HC, white circles) and CF patients (black circles) at stable disease (Bsl), at PE onset (Day 1), throughout PE treatment (Days 7, 14 and 21) and post treatment (Day 42). A) AA levels decreased during PE treatment and were significantly different from Bsl values at Day 21 (p<0.05). All PE time points including Bsl were significantly different from HC, except on Day 21 where there was no longer a difference with HC. B) DHA levels improved with PE treatment and were significantly increased from Bsl values at Day 21 (p<0.05). All PE time points including Bsl were significantly different from HC. C) Overall, the AA/DHA ratio was significantly decreased from Bsl values on Day 21 (p<0.05). All PE time points including Bsl were significantly different from HC, except on Day 21 where there was no difference with HC. D) MDA levels improved with treatment however no statistical difference was detected from Bsl. All PE time points including Bsl were significantly different from HC, except on Day 21 where there was no difference with HC. Solid lines indicate the means of the groups. Dotted lines indicate the HC mean and grey shadowing illustrates the min-max range for HC values. * represents significant difference from Bsl group using the Bonferroni post-test after ANOVA. † indicates significant difference from HC group using the Bonferroni post-test after ANOVA. Significance set as p<0.05. HC n = 10, CF n = 8–13.

Similar articles

Cited by

References

    1. Parkins MD, Rendall JC, Elborn JS (2012) Incidence and risk factors for pulmonary exacerbation treatment failures in patients with cystic fibrosis chronically infected with Pseudomonas aeruginosa. Chest 141: 485–493. - PubMed
    1. Sanders DB, Bittner RC, Rosenfeld M, Hoffman LR, Redding GJ, et al. (2010) Failure to recover to baseline pulmonary function after cystic fibrosis pulmonary exacerbation. Am J Respir Crit Care Med 182: 627–632. - PMC - PubMed
    1. Liou TG, Adler FR, Fitzsimmons SC, Cahill BC, Hibbs JR, et al. (2001) Predictive 5-year survivorship model of cystic fibrosis. Am J Epidemiol 153: 345–352. - PMC - PubMed
    1. Waters V, Stanojevic S, Atenafu EG, Lu A, Yau Y, et al. (2012) Effect of pulmonary exacerbations on long-term lung function decline in cystic fibrosis. Eur Respir J 40: 61–66. - PubMed
    1. de Boer K, Vandemheen KL, Tullis E, Doucette S, Fergusson D, et al. (2011) Exacerbation frequency and clinical outcomes in adult patients with cystic fibrosis. Thorax 66: 680–685. - PubMed

Publication types

MeSH terms