Review
. 2014 Apr:78:47-75.
doi: 10.1016/j.pnmrs.2013.12.001. Epub 2013 Dec 15.

Practical aspects of NMR signal assignment in larger and challenging proteins

Affiliations
Review

Practical aspects of NMR signal assignment in larger and challenging proteins

Dominique P Frueh. Prog Nucl Magn Reson Spectrosc. 2014 Apr.

Abstract

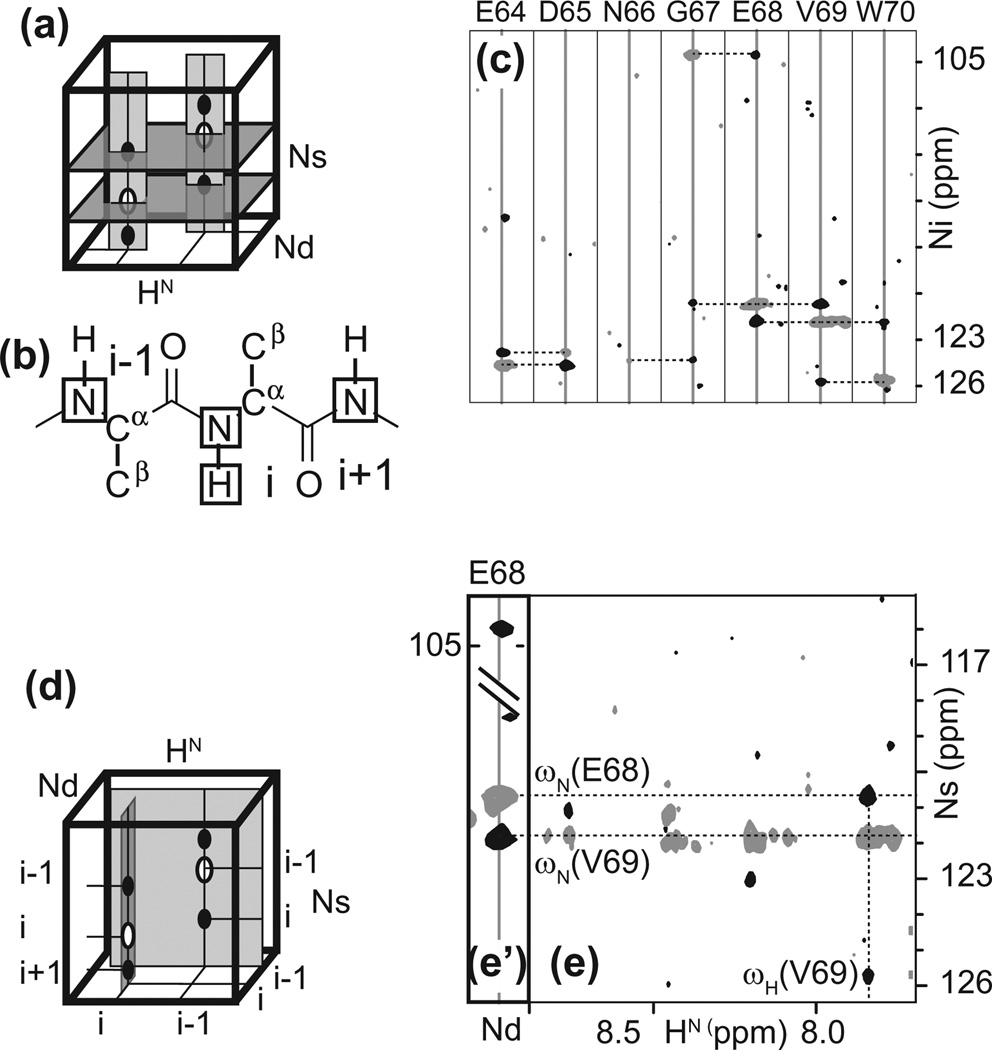
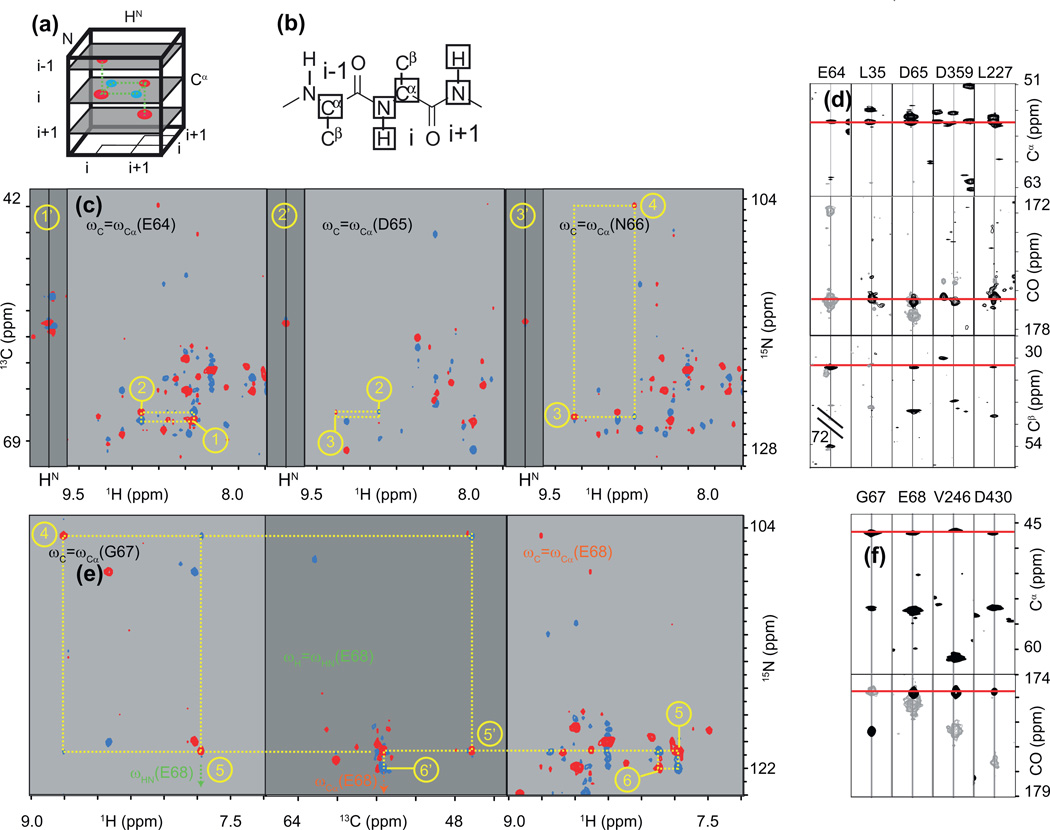
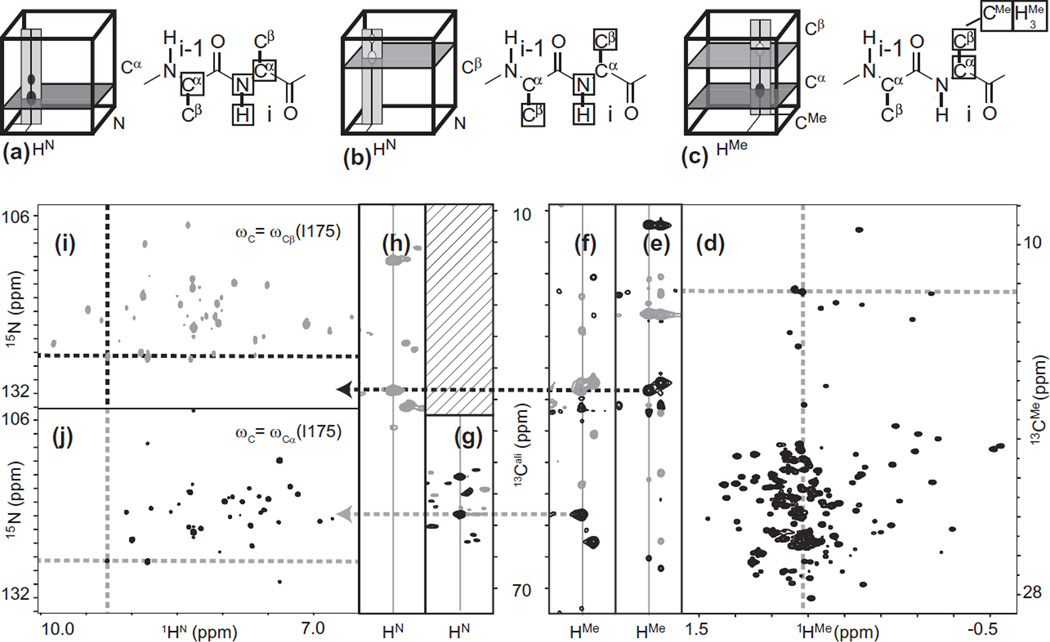
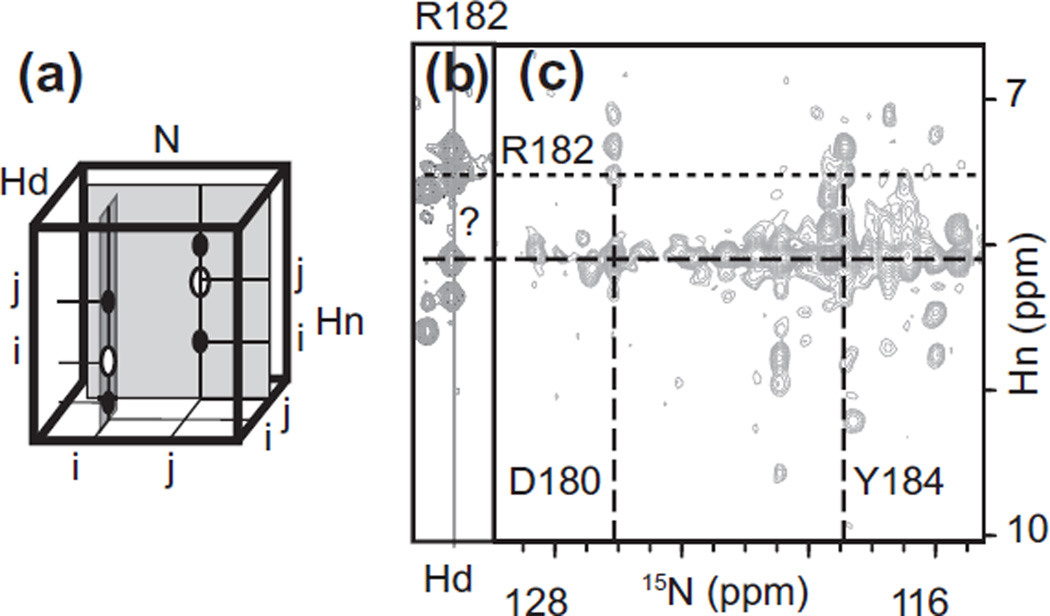
NMR has matured into a technique routinely employed for studying proteins in near physiological conditions. However, applications to larger proteins are impeded by the complexity of the various correlation maps necessary to assign NMR signals. This article reviews the data analysis techniques traditionally employed for resonance assignment and describes alternative protocols necessary for overcoming challenges in large protein spectra. In particular, simultaneous analysis of multiple spectra may help overcome ambiguities or may reveal correlations in an indirect manner. Similarly, visualization of orthogonal planes in a multidimensional spectrum can provide alternative assignment procedures. We describe examples of such strategies for assignment of backbone, methyl, and nOe resonances. We describe experimental aspects of data acquisition for the related experiments and provide guidelines for preliminary studies. Focus is placed on large folded monomeric proteins and examples are provided for 37, 48, 53, and 81 kDa proteins.

Keywords: Large protein; Nuclear Magnetic Resonance (NMR); Resonance assignment; Spectra analysis; Spectral overlap.


Figures

Fig. 1
Fig. 1
Optimization of NMR buffer (a) and concentration test (b). (a) Top, in phosphate buffer, 150 mM NaCl, pH 6.7, this 12 kDa alpha-helical protein displays signs of improper folding and aggregation. Precipitation was observed within hours. Bottom, in PIPES, 150 mM NaCl, 2 mM MgCl2, the more uniform signal intensity indicates that the protein is now well folded and aggregation was not observed for several days. (b) HN-trosy-HSQC ID spectra of a 48 kDa protein at 1.5 mM (red), diluted to 260 µM (purple), and subsequently re-concentrated to 390 µM (black). All measurement conditions are identical. Concentrations were determined by UV spectroscopy, and the one of the diluted sample was verified by calculation using the final volume after dilution. The agreement between the concentrations estimated with the two methods indicates that no solute has been lost through precipitation. See text for details of interpretation.
Fig. 2
Fig. 2
Correlations used for assigning backbone resonances with conventional experiments in large proteins. The cartoons on the left depict signals for two sequential residues. Strips that are extracted for comparisons are shown in light grey. The dark gray planes emphasize signals common to sequential residues. (a) HNCA. (b) HNCO. (c) HN(CA)CO. (d) HN(CA)CB. On the right, the rectangles indicate the set of nuclei that are correlated by each experiment for a residue i in a protein.
Fig. 3
Fig. 3
Strip matching for identifying sequential residues of a 48 kDa protein. The strips of the residue for which a successor is being sought (N66) are highlighted by the thick frames. (a) Comparison of Cα strips extracted from from trosy-HNCA. (b) C strips extracted from trosy-HN(CA)CO (grey) and from trosy-HNCO (black). (c) Cβ strips extracted from trosy-HN(CA)CB. Signals in grey have opposite phases and correspond to alpha carbons. The dotted lines indicate the carbon frequencies used for comparisons. Panels marked with an X denote sequential residue candidates that can be discarded. In this example, the combination of all three experiments identifies a unique sequential residue candidate. See text for details of interpretation.
Fig. 4
Fig. 4
Mean chemical shifts and standard deviations used for residue type assignment. Data compiled from BRMB as updated on 02/14/2013. (Top) Alpha (grey) and beta (black) carbon shifts. (Bottom) Carbonyl carbon shifts. Rectangles highlight chemical shifts with values characteristic of a given residue type or small group of residue types. Often, chemical shifts of different carbons must be considered together for reside type identification.
Fig. 5
Fig. 5
Application of non-uniform sampling (NUS) to the assignment of resonances of larger proteins. (a) Comparison of acquisition schemes for uniform (red) and nonuniform sampling (black). In both cases, 1025 complex points are being acquired and the experimental time is the same. The NUS schedule has been optimized for a trosy-HNCO recorded on a 48 kDa protein (Table 1). (b) Comparison of H/N projections of the 3D-HNCO experiment recorded with the schedules shown in (a). With a linear acquisition (red) only one (H, N) correlation is observed near the resonance of R226 (blue crosshair). With NUS (black), four (H, N) correlations can be distinguished. (b’) H/CO strip and (b”) N/CO strip at the shifts of R226. The 13C dimension shows four correlations in the linear acquisition (two of which cannot be assigned in the uniformly sampled spectrum because of simultaneous degeneracies in 1H and 15N frequencies). NUS reveals a fifth correlation and due to the higher resolution all five signals can now be assigned to different (H, N) correlations. (c) trosy-HNCO H/CO strips of a sequential fragment encompassing R226 showing both uniform (red) and non-uniform sampling (black). See text for details of interpretation.
Fig. 6
Fig. 6
H/C strips of a sequential fragment for spectra recorded with NUS acquisition. (a) trosy-HNCA of a 48 kDa protein. Non-uniform sampling resolves the signals of E64, D65 and N66 alpha carbons, which would otherwise produce overlapping sequential and intra-residue signals. (b) trosy-HN(CA)CO (gray) and trosy-HNCO (black). The insert shows that the carbonyl carbons signals of E68 and V69 can be distinguished in the H/CO strip of V69. The H/CO strip of E70 shows that the 13C resolution in trosy-HNCO is sufficient to resolve a partial overlap in the 1H and 13C dimensions. (c) trosy-HN(CA)CB. The lines (\\) indicate an interruption in the chemical shift scale for E64. The signals in gray have an opposite phase and belong to the alpha carbon of a glycine (G67). See text for details of interpretation.
Fig. 7
Fig. 7
Assignment by synchronization. Shown are H/N planes of trosy-HNCA (a), trosy-HN(CA)CB (b), and trosy-HN(CA)CO (c, gray) in overlay with trosy-HNCO (c, black). The planes are chosen at the carbon frequencies of D65 (intra-residue correlation). The dotted-line circle indicates the (H, N) coordinate of the residue for which a successor is being sought (D65). The dotted crosshairs indicate the position of the signal of the successor, N66, which displays sequential correlations with D65 that appear in all H/N planes. All spectra were recorded with non-uniform sampling. See text for details of interpretation.
Fig. 8
Fig. 8
(H)N(CA)NH and assignment by matching correlations in orthogonal planes. (a) Cartoon representation of the trosy-(H)N(CA)NH spectrum depicting signals for two sequential residues. Strips that are extracted for comparisons are shown in light grey. Nd: N direct (directly attached to H); Ns: N sequential. (b) The coherences correlated to the {H, N} system of residue i are depicted by squares on a peptide fragment. (c) Strips of a sequential fragment. Intra-residue correlation peaks are in gray while inter-residue correlation peaks have opposite phases and are in black. The lack of signals in the strip of N66 results in part from the overlap between the positive intra-residue signal of N66 and the negative sequential cross-peak with N65. All other strips show two sequential correlations. (d) Cartoon of trosy-(H)N(CA)NH highlighting correlations that can be compared in orthogonal planes, (e) H/Ns plane of trosy-(H)N(CA)NH at the frequency ωNd= ωN(V69). (e’) Nd/ Ns strip at ωH = ωH(E68) and ωNd = ωN(E68). The example demonstrates how both nitrogen and proton frequencies of V69 can be determined simultaneously with trosy-(H)N(CA)NH. See text for details of interpretation.
Fig. 9
Fig. 9
trosy-(H)NCA(N)H and “backbone stairway” assignment. (a) Cartoon representation of the trosy-(H)NCA(N)H spectrum. Intra-residue (H, N) correlations appearing at a given carbon frequency are in red and sequential cross-peaks are in blue. (b) Coherences correlated to the {H, N} system of a residue i are depicted as squares on a peptide fragment. (c) Stairway assignment using H/C strips (dark gray) and H/N planes (light gray). The numbers in yellow denote the order in which the signals of sequential residues are identified, and those with a prime (‘) indicate dimensions orthogonal to those without a prime. See main text for further explanation. (d) Unsuccessful strip matching of E64 with D65, corresponding to points (1) and (2) in (c). Signals of trosy-HN(CA)CO are in gray and those of trosy-HNCO in black. The lines (\\) denote an interruption in the chemical shift scale of E64 in trosy-HN(CA)CB. (e) Stairway assignment using C/N planes (dark gray) and H/N planes (light gray). (f) Unsuccessful strip matching of G67 and E68, corresponding to (5) and (6) in (e). Signals of trosy-HN(CA)CO are in gray and those of trosy-HNCO in black. See text for details of interpretation.
Fig. 10
Fig. 10
Backbone assignment with 4D-trosy-HNCACO, 4D-trosy-HNCOCA and 4D-trosy-HNCOi–1CAi. The frequencies of the two invisible dimensions are indicated on each plane visualized. The frequencies determined following plane inspections are indicated near the arrows. (a) CO/CA plane of 4D-trosy-HNCACO revealing the signal of A33. (b) Corresponding H/N plane in 4D-trosy-HNCOCA revealing the (H, N) correlation of A34. (c, d and e) CO/CA planes of 4D-trosy-HNCACO, 4D-trosy-HNCOCA and 4D-trosy-HNCOi–1 CAi, used to identify the carbon shifts of A34. (f) H/N plane of 4D-trosy-HNCOCA and (g) H/N plane of 4D-HN-HSQC-NOESY-HN-trosy-HSQC used to identify the (H, N) correlation of F35. The colors are coded according to the residue for which the correlations belong. See text for details of interpretation. Adapted with permission from “V. Tugarinov, R. Muhandiram, A. Ayed, LE. Kay, Four-dimensional NMR spectroscopy of a 723-residue protein: chemical shift assignments and secondary structure of malate synthase g, J. Am. Chem. Soc. 124 (2002) 10025–10035” Copyright 2002 American Chemical Society [98].
Fig. 11
Fig. 11
Assignment of Ile, Leu, and Val methyl resonances. Cartoons of trosy-HNCA (a), trosy-HN(CA)CB (b), and HMCM(CG)CBCA (c) highlighting planes displayed in (d, i, and j) (darker grey) and strips shown in (e, f, g, and h). The squares on the peptide fragments indicate the nuclei that are correlated in the respective experiments. (d) HMeCMe-HMQC of a 53 kDa protein. The dashed lines indicate the position of the orthogonal strips in (b and c), at the coordinates of I175 (crosshair). (e) HMe/Cali strip of HMCMCGCB (V-HMCMCBCA for valines, not shown). Signals of Cγ and Cβ have opposite signs; Cγ appear in gray and Cβ in black. (f) HMe/Cali strip of HMCM(CG)CBCA (V-HMCM(CB)CACB for valines, not shown). Signals of Cβ and Cα have opposite signs; Cβ appear in gray and Cα in black. (g) HN/Cα strip of HNCA and (h) HN/Cβ strip of HN(CA)CB for I175. (i) HN(CA)CB and (j) HNCA H/N planes at the carbon frequencies of I175 Cβ and Cα, respectively. The crosshair denotes the (H, N) coordinates of I175. See text for details of interpretation.
Fig. 12
Fig. 12
HN → HN nOe assignment by matching correlations in orthogonal planes of 3D-NOESY-HN-trosy-HSQC. (a) Cartoon of NOESY-HN-trosy-HSQC (or HSQC-NOESY) highlighting correlations that can be compared in orthogonal planes. Hd: dimension with 1H directly connected to 15N. Hn: dimension with nOe cross-peaks. White ovals denote autocorrelation signals (diagonal peaks), while black ovals indicate correlation signals resulting from nOes (cross-peaks). (b) Hd/Hn strip of R182 in a 53 kDa protein. The cross-peak to be assigned is labeled with “?”. The horizontal dotted and dashed lines show the proton frequencies of R182 and of the unassigned signal, respectively. (c) N/Hn plane at the Hd frequency of the cross-peak with label “?”. The vertical dashed lines highlight the nitrogen chemical shifts of residues that feature a cross-peak with R182. Here two residues with degenerate proton frequencies, D180 and Y184, each contribute to the nOe cross-peak labeled “?”. See text for details of interpretation.
Fig. 13
Fig. 13
HN → HC nOe assignment by matching correlations in orthogonal planes of 3D-NOESY-HN-trosy-HSQC and 3D-NOESY-HC-HSQC. (a) Cartoon representation of the procedure used to assign nOe cross peaks to methyls in a 3D NOESY-HN-trosy-HSQC. (b) HN/H strip of G294 in 3D NOESY-HN-trosy-HSQC recorded on a 53 kDa protein. The horizontal dotted line denotes the proton frequency of the methyl that needs to be assigned and the horizontal dashed line denotes the frequency of HN G294. (c) C/H plane of 3D NOESY-HC-HSQC at the frequency ωHMe = ωHMe(V293) identified in (b). The vertical dotted line denotes the carbon frequency of V293, the only residue with a cross-peak at ωHN(G294). Note that other residues with apparent cross-peaks to G294 can be discarded after viewing expansions (not shown here) around the cross-peaks, which reveals subtle but unambiguous differences in proton frequencies. (d) Cartoon representation of the procedure used to assign nOe cross peaks to amides in a 3D NOESY-HC-HSQC. (e) HMe/H strip of V293 in 3D NOESY-HC-HSQC. The horizontal dashed line now denotes the amide proton that needs to be assigned. (f) N/H plane of 3D NOESY-HN-trosy-HSQC at the frequency ωHN = ωHN(G294) identified in e. See text for details of interpretation.
Fig. 14
Fig. 14
nOe assignment with time-shared 4D NOESY spectra. For clarity, the labeling of the cross-peaks departs from the convention used in the remainder of the article. Superscripts refer to chemical groups and subscripts refer to residue numbers. (a) Cartoon representing the 4D spectrum as a 2D array of 2D planes. The axis labels are used to describe panels c, e, and g. In (c), ω23 planes are displayed (i.e. like the shaded planes in panel (a) and in (e and g) ω14 planes are displayed (i.e. like the unshaded plane in panel (a). (b) HN → HN: Strip comparison of the 3D NOESY-HN-trosy-HSQC obtained with the time-shared technique on a 37 kDa protein, with G172 as a reference strip. Only the amide region is investigated. Based on this information, all candidates could be correlated to either G172 or A201 or both. See text for a detailed description. The circle indicates the (HN, N) correlation of G172 that is used to provide the coordinates in the 4D experiment. (c) HN → HN: 4D HN-HSQC-NOESY-HN-trosy-HSQC. Shown is the HN/N plane along ω2 and ω3 at the coordinates ω1 = ωN(G172) and ω4 = ωH(G172), which unambiguously shows that it is Q199 that has the nOe with G172. (d) HMe → HN: Strip comparison of the 3D NOESY-HN-trosy-HSQC showing both the amide and methyl regions. The circle indicates the (HN, N) correlation that provides the coordinates in (e). Based on this information, it is unclear whether the nOe from A23 NH involves the δ1 methyl of I22, the γ1 methyl of V77, or both (e) HMe → HN: HMe/C plane of the 4D-HN-HSQC-NOESY-HC-HSQC at the coordinates (ω1, ω3) = [ωH(A23), ωN(A23)]. The vertical dashed line indicates the frequency corresponding to the horizontal dashed line in d, and the cross-peaks in this plane show that both candidate methyls identified by analysing the 3D spectrum have an nOe interaction with A23 HN, with the larger contribution coming from Val77 γ1. (f) HMe → HMe: Strip comparison of the 3D NOESY-HC-HSQC showing the methyl region. The circle indicates the (HMe, C) correlation that provides the coordinates in (g). The frequency of the cross-peak inspected in g is denoted by the horizontal dashed line. Two residues, L54 and L193, have proton frequencies matching that of the cross-peak seen in the strip of V71 and feature two cross-peaks at frequencies corresponding to both methyl protons of V71. (g) HMe → HMe: HMe/C plane of the 4D-HC-HSQC-NOESY-HC-HSQC at the coordinates (ω2, ω3) = [ωHγ1(V71), ωCγ1(V71)]. The vertical dashed line indicates the frequency corresponding to the horizontal dashed line in (e) and reveals that the g1 methyl of V71 is near in space to L54 and not L193. See text for details of interpretation. Adapted from “D.P. Frueh, D.A. Vosburg, C.T. Walsh, G. Wagner, Determination of all nOes in 1H–13C–Me–ILV–U–2H–15N proteins with two time-shared experiments, J. Biomol. NMR 34 (2006) 31–40” with kind permission from Springer Science and Business Media [155].

Similar articles

Cited by

References

    1. Keller RLJ. The Computer Aided Resonance Assignment Tutorial, Cantina Verlag, Goldau. 2004
    1. Vranken WF, Boucher W, Stevens TJ, Fogh RH, Pajon A, Llinas M, Ulrich EL, Markley JL, Ionides J, Laue ED. The CCPN data model for NMR spectroscopy: development of a software pipeline. Proteins: Struct. Funct. Bioinform. 2005;59:687–696. - PubMed
    1. Goddard T, Kneller D. SPARKY 3. San Fransisco: Univeristy of California;
    1. Johnson BA, Blevins RA. NMR view: a computer program for the visualization and analysis of NMR data. J. Biomol. NMR. 1994;4:603–614. - PubMed
    1. Peti W, Page R. Strategies to maximize heterologous protein expression in Escherichia coli with minimal cost. Protein Exp. Purif. 2007;51:1–10. - PubMed

LinkOut - more resources