

Spike-wave discharges in adult Sprague-Dawley rats and their implications for animal models of temporal lobe epilepsy
- PMID: 24534480
- PMCID: PMC3984461
- DOI: 10.1016/j.yebeh.2014.01.004
Spike-wave discharges in adult Sprague-Dawley rats and their implications for animal models of temporal lobe epilepsy
Abstract
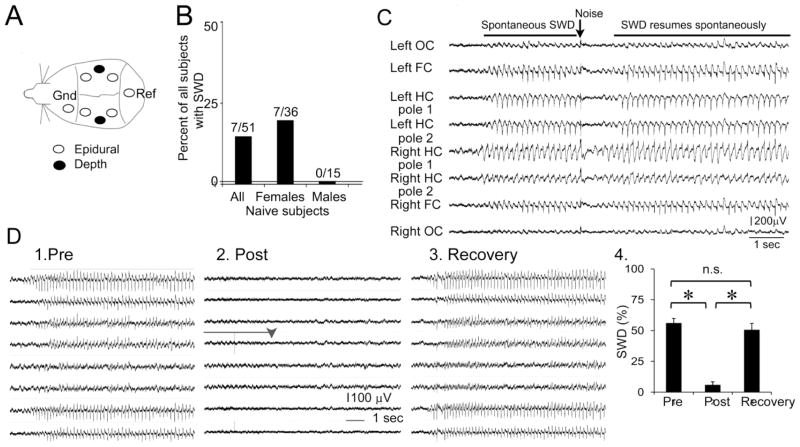
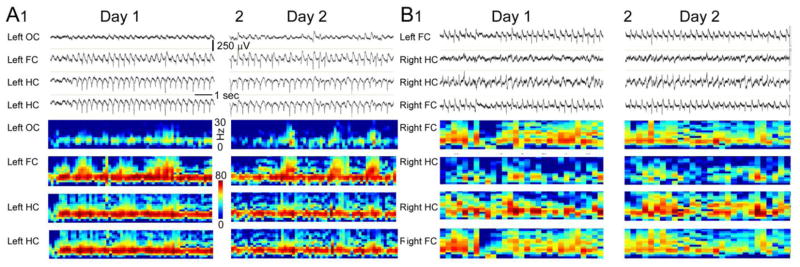
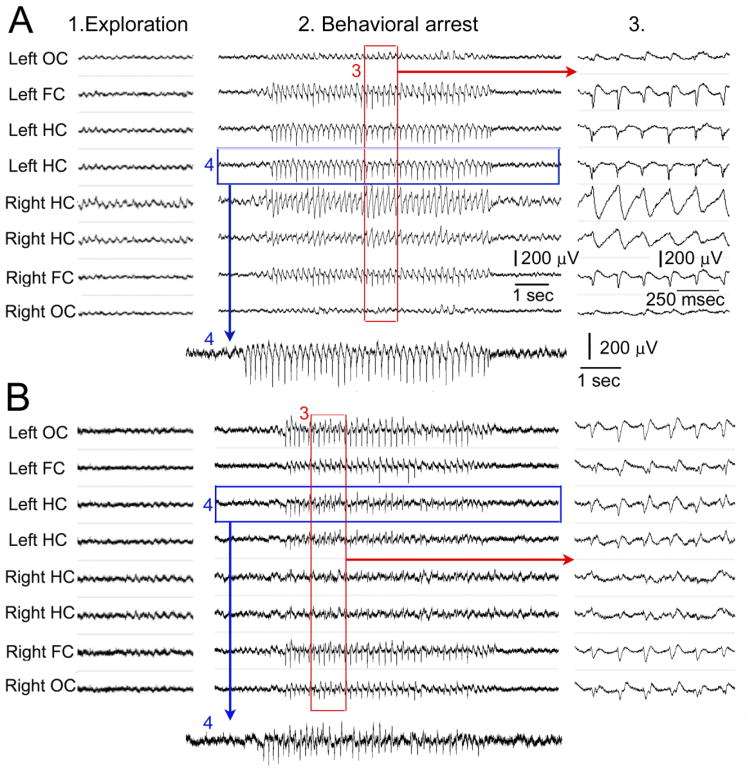
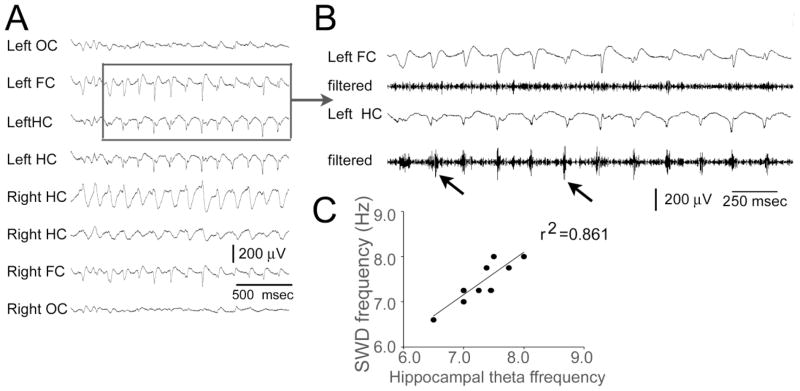
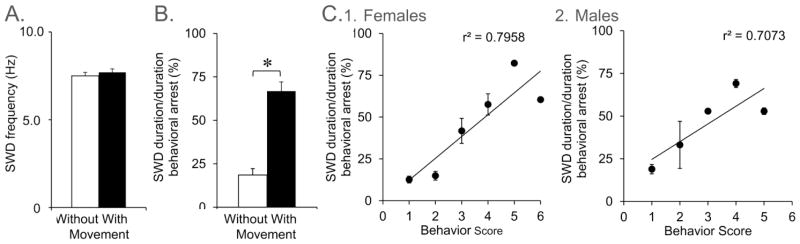
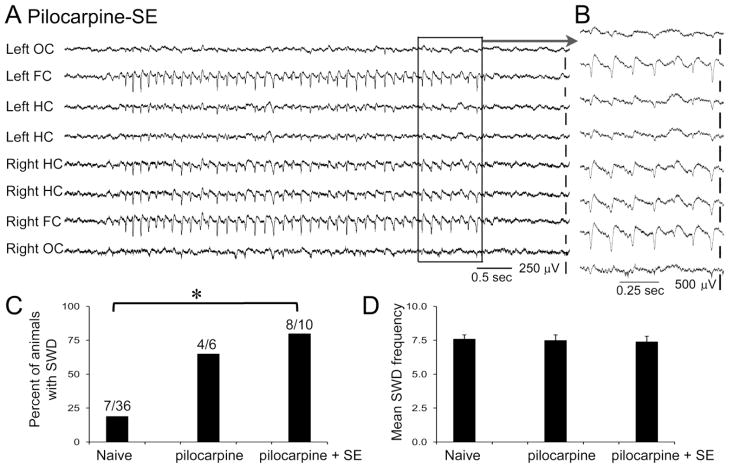
Spike-wave discharges (SWDs) are thalamocortical oscillations that are often considered to be the EEG correlate of absence seizures. Genetic absence epilepsy rats of Strasbourg (GAERS) and Wistar Albino Glaxo rats from Rijswijk (WAG/Rij) exhibit SWDs and are considered to be genetic animal models of absence epilepsy. However, it has been reported that other rat strains have SWDs, suggesting that SWDs may vary in their prevalence, but all rats have a predisposition for them. This is important because many of these rat strains are used to study temporal lobe epilepsy (TLE), where it is assumed that there is no seizure-like activity in controls. In the course of other studies using the Sprague-Dawley rat, a common rat strain for animal models of TLE, we found that approximately 19% of 2- to 3-month-old naive female Sprague-Dawley rats exhibited SWDs spontaneously during periods of behavioral arrest, which continued for months. Males exhibited SWDs only after 3 months of age, consistent with previous reports (Buzsáki et al., 1990). Housing in atypical lighting during early life appeared to facilitate the incidence of SWDs. Spike-wave discharges were often accompanied by behaviors similar to stage 1-2 limbic seizures. Therefore, additional analyses were made to address the similarity. We observed that the frequency of SWDs was similar to that of hippocampal theta rhythm during exploration for a given animal, typically 7-8 Hz. Therefore, activity in the frequency of theta rhythm that occurs during frozen behavior may not reflect seizures necessarily. Hippocampal recordings exhibited high frequency oscillations (>250 Hz) during SWDs, suggesting that neuronal activity in the hippocampus occurs during SWDs, i.e., it is not a passive structure. The data also suggest that high frequency oscillations, if rhythmic, may reflect SWDs. We also confirmed that SWDs were present in a common animal model of TLE, the pilocarpine model, using female Sprague-Dawley rats. Therefore, damage and associated changes to thalamic, hippocampal, and cortical neurons do not prevent SWDs, at least in this animal model. The results suggest that it is possible that SWDs occur in rodent models of TLE and that investigators mistakenly assume that they are stage 1-2 limbic seizures. We discuss the implications of the results and ways to avoid the potential problems associated with SWDs in animal models of TLE.
Keywords: Absence seizures; Female; Limbic seizures; Pilocarpine; Thalamocortical oscillations; Video-EEG.
Copyright © 2014 Elsevier Inc. All rights reserved.
Figures
Similar articles
-
The effect of generalized absence seizures on the progression of kindling in the rat.Epilepsia. 2007;48 Suppl 5:150-6. doi: 10.1111/j.1528-1167.2007.01303.x. Epilepsia. 2007. PMID: 17910595
-
Alterations in hippocampal and cortical densities of functionally different interneurons in rat models of absence epilepsy.Epilepsy Res. 2018 Sep;145:40-50. doi: 10.1016/j.eplepsyres.2018.05.013. Epub 2018 May 31. Epilepsy Res. 2018. PMID: 29885592
-
The effect of amygdala kindling on neuronal firing patterns in the lateral thalamus in the GAERS model of absence epilepsy.Epilepsia. 2014 May;55(5):654-665. doi: 10.1111/epi.12592. Epub 2014 Mar 27. Epilepsia. 2014. PMID: 24673730
-
Pathophysiological mechanisms of genetic absence epilepsy in the rat.Prog Neurobiol. 1998 May;55(1):27-57. doi: 10.1016/s0301-0082(97)00091-9. Prog Neurobiol. 1998. PMID: 9602499 Review.
-
Genetic animal models for absence epilepsy: a review of the WAG/Rij strain of rats.Behav Genet. 2003 Nov;33(6):635-55. doi: 10.1023/a:1026179013847. Behav Genet. 2003. PMID: 14574120 Review.
Cited by
-
Electroconvulsive Shock Enhances Responsive Motility and Purinergic Currents in Microglia in the Mouse Hippocampus.eNeuro. 2019 Apr 23;6(2):ENEURO.0056-19.2019. doi: 10.1523/ENEURO.0056-19.2019. eCollection 2019 Mar-Apr. eNeuro. 2019. PMID: 31058213 Free PMC article.
-
A deletion in Eml1 leads to bilateral subcortical heterotopia in the tish rat.Neurobiol Dis. 2020 Jul;140:104836. doi: 10.1016/j.nbd.2020.104836. Epub 2020 Mar 13. Neurobiol Dis. 2020. PMID: 32179177 Free PMC article.
-
Spike and wave discharges and fast ripples during posttraumatic epileptogenesis.Epilepsia. 2021 Aug;62(8):1842-1851. doi: 10.1111/epi.16958. Epub 2021 Jun 21. Epilepsia. 2021. PMID: 34155626 Free PMC article.
-
Robust chronic convulsive seizures, high frequency oscillations, and human seizure onset patterns in an intrahippocampal kainic acid model in mice.Neurobiol Dis. 2022 May;166:105637. doi: 10.1016/j.nbd.2022.105637. Epub 2022 Jan 26. Neurobiol Dis. 2022. PMID: 35091040 Free PMC article.
-
A predictive epilepsy index based on probabilistic classification of interictal spike waveforms.PLoS One. 2018 Nov 6;13(11):e0207158. doi: 10.1371/journal.pone.0207158. eCollection 2018. PLoS One. 2018. PMID: 30399183 Free PMC article.
References
-
- Buzsáki G, Laszlovszky I, Lajtha A, Vadasz C. Spike-and-wave neocortical patterns in rats: genetic and aminergic control. Neuroscience. 1990;38:323–33. - PubMed
-
- Steriade M. Neuronal substrates of spike-wave seizures and hypsarrhythmia in corticothalamic systems. Adv Neurol. 2006;97:149–54. - PubMed
-
- Huguenard JR, McCormick DA. Thalamic synchrony and dynamic regulation of global forebrain oscillations. Trends Neurosci. 2007;30:350–6. - PubMed
-
- Blumenfeld H. Cellular and network mechanisms of spike-wave seizures. Epilepsia. 2005;46 (Suppl 9):21–33. - PubMed
Publication types
MeSH terms
Substances
Grants and funding
LinkOut - more resources
Full Text Sources
Other Literature Sources
