. 2014 Mar 15;192(6):2677-88.
doi: 10.4049/jimmunol.1302765. Epub 2014 Feb 17.

The transcription factor E4BP4 is not required for extramedullary pathways of NK cell development

Affiliations

The transcription factor E4BP4 is not required for extramedullary pathways of NK cell development

Stefania Crotta et al. J Immunol. .

Abstract

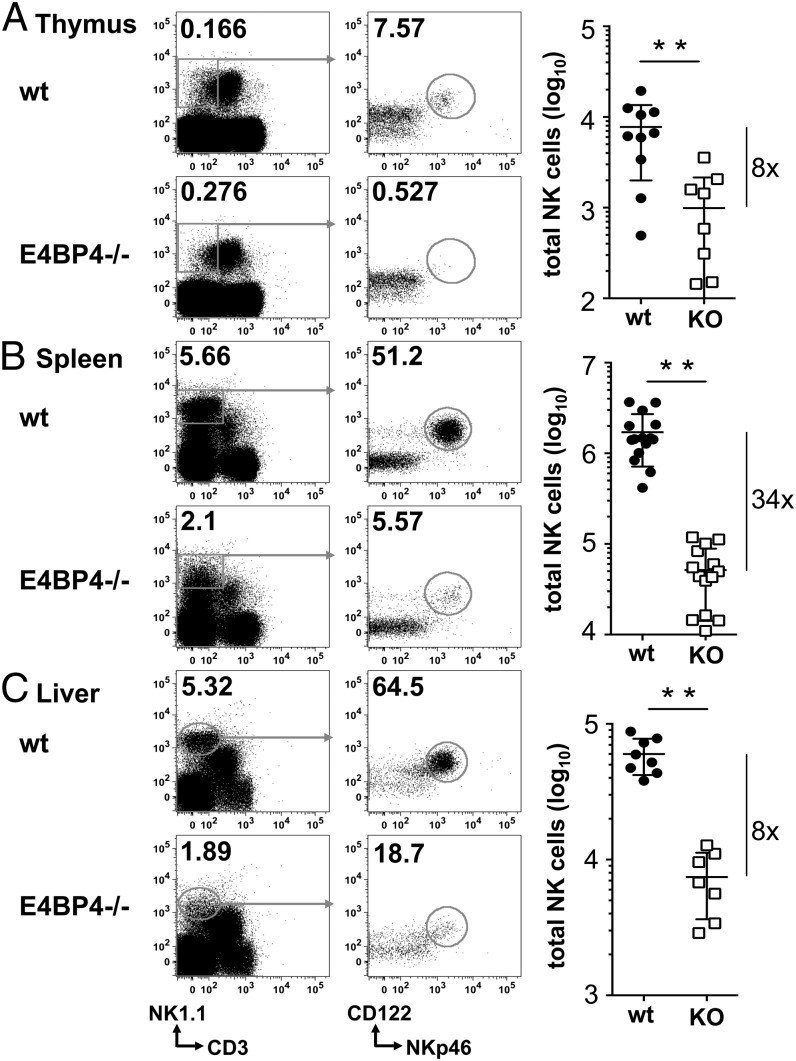
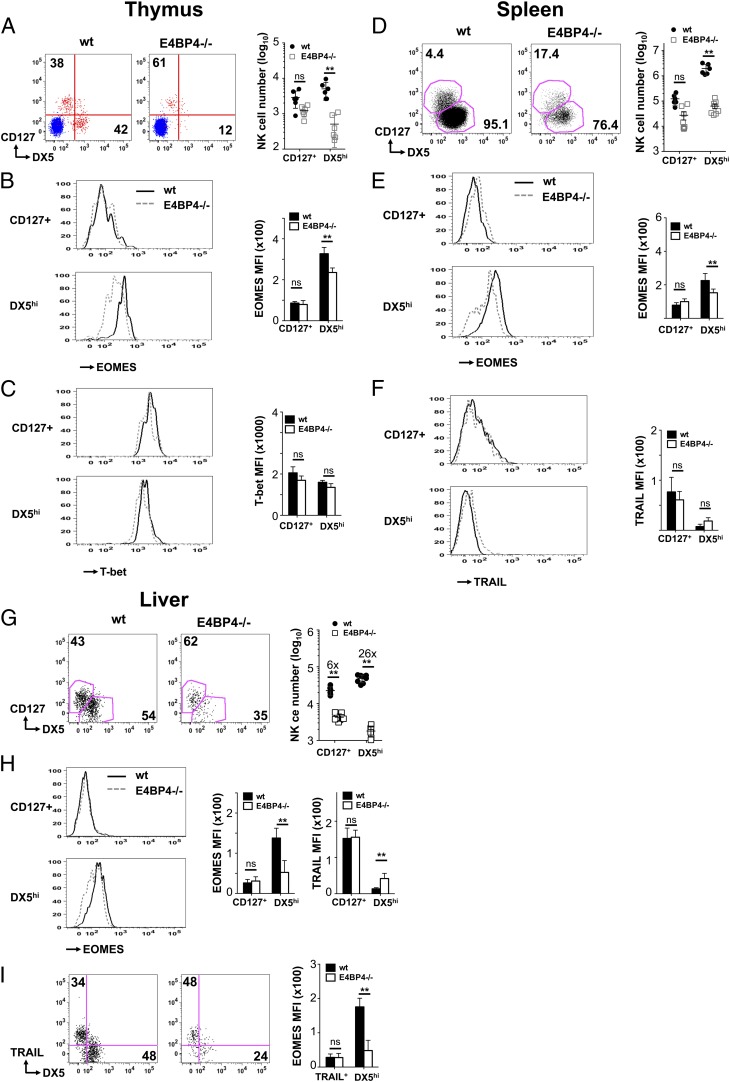
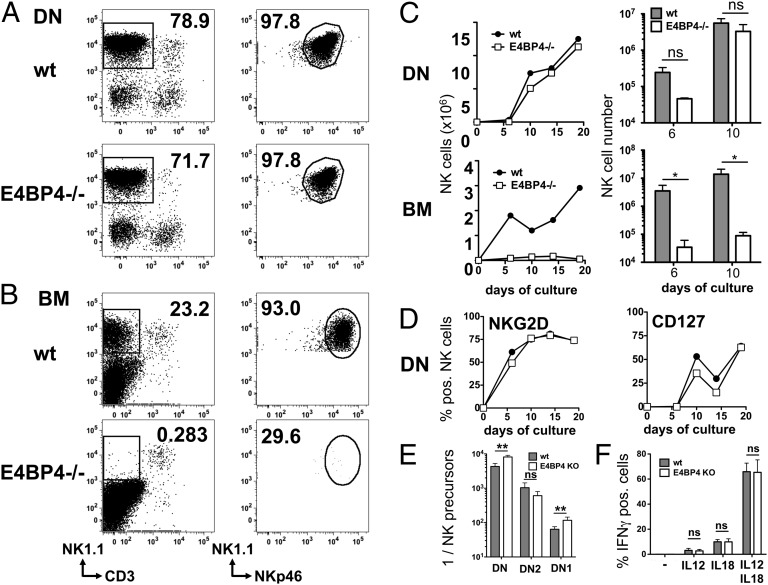
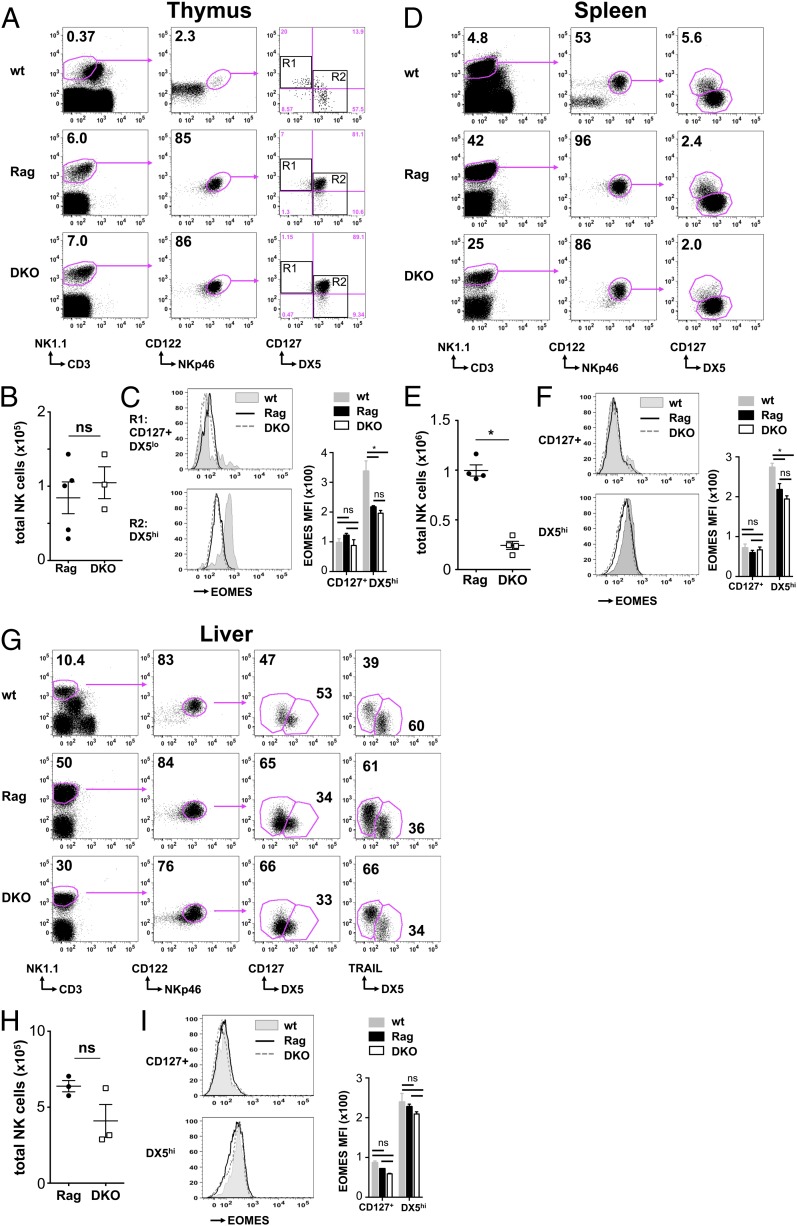
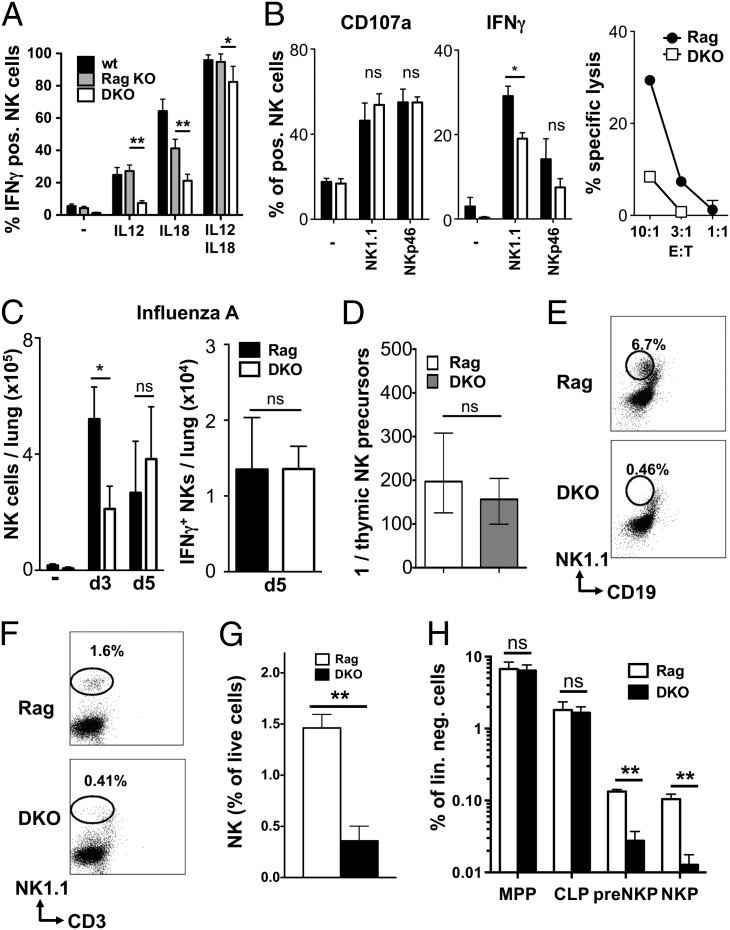
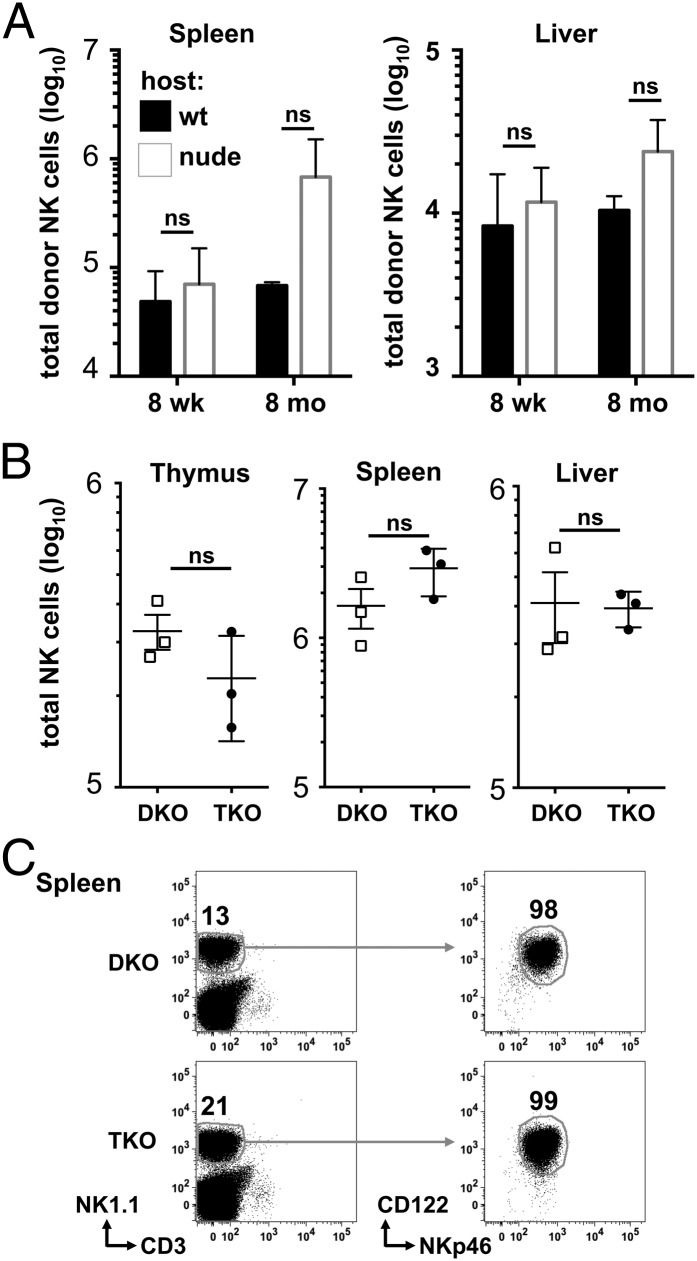
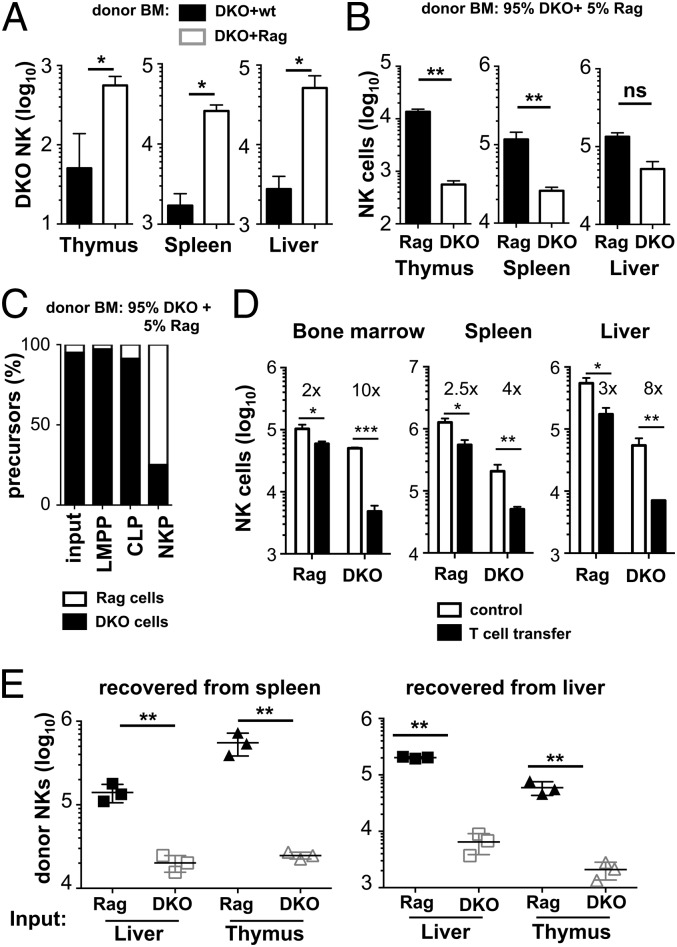
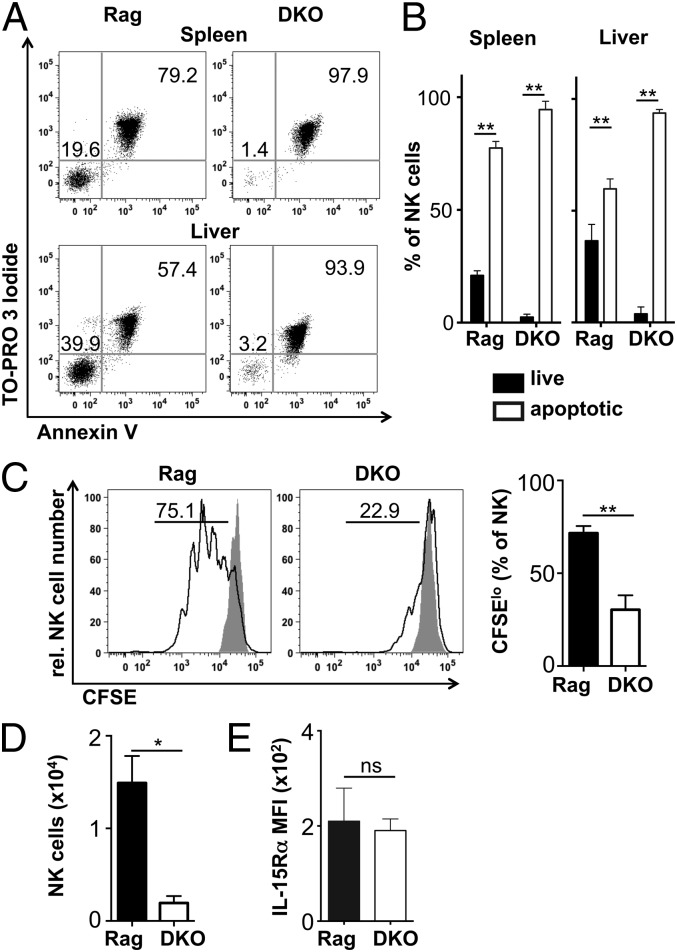
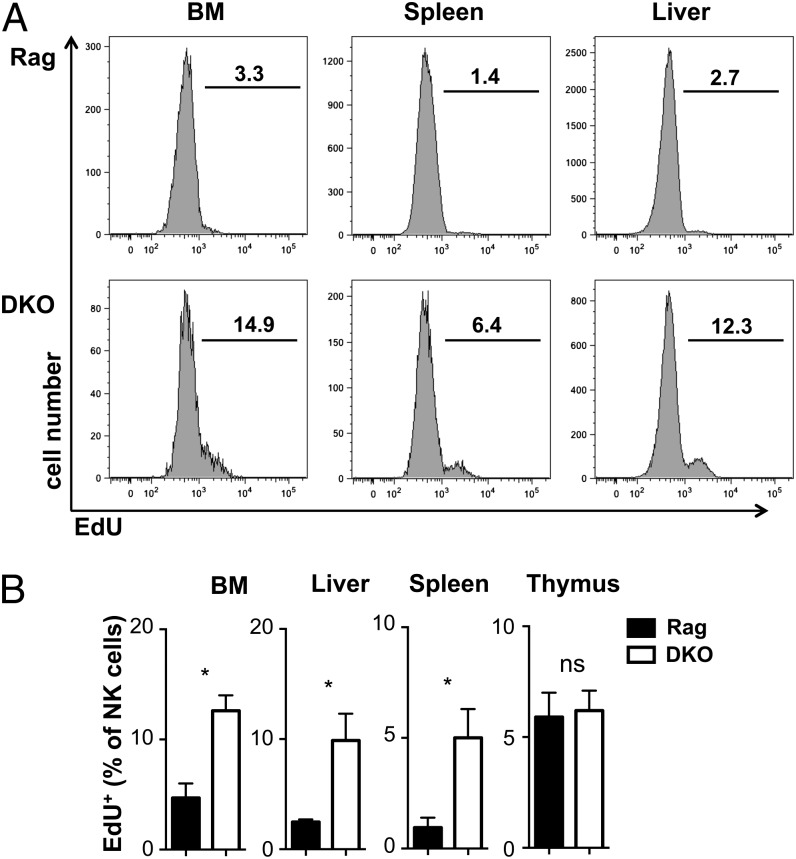
NK cells contribute to antitumor and antiviral immunosurveillance. Their development in the bone marrow (BM) requires the transcription factor E4BP4/NFIL3, but requirements in other organs are less well defined. In this study, we show that CD3(-)NK1.1(+)NKp46(+)CD122(+) NK cells of immature phenotype and expressing low eomesodermin levels are found in thymus, spleen, and liver of E4BP4-deficient mice, whereas numbers of mature, eomesodermin(high) conventional NK cells are drastically reduced. E4BP4-deficient CD44(+)CD25(-) double-negative 1 thymocytes efficiently develop in vitro into NK cells with kinetics, phenotype, and functionality similar to wild-type controls, whereas no NK cells develop from E4BP4-deficient BM precursors. In E4BP4/Rag-1 double-deficient (DKO) mice, NK cells resembling those in Rag-1-deficient controls are found in similar numbers in the thymus and liver. However, NK precursors are reduced in DKO BM, and no NK cells develop from DKO BM progenitors in vitro. DKO thymocyte precursors readily develop into NK cells, but DKO BM transfers into nude recipients and NK cells in E4BP4/Rag-1/IL-7 triple-KO mice indicated thymus-independent NK cell development. In the presence of T cells or E4BP4-sufficient NK cells, DKO NK cells have a selective disadvantage, and thymic and hepatic DKO NK cells show reduced survival when adoptively transferred into lymphopenic hosts. This correlates with higher apoptosis rates and lower responsiveness to IL-15 in vitro. In conclusion, we demonstrate E4BP4-independent development of NK cells of immature phenotype, reduced fitness, short t1/2, and potential extramedullary origin. Our data identify E4BP4-independent NK cell developmental pathways and a role for E4BP4 in NK cell homeostasis.


Figures

FIGURE 1.
FIGURE 1.
NK frequencies and numbers are reduced in E4BP4-deficient mice. The wt and E4BP4−/− thymi (A), spleens (B), and livers (C) were analyzed for the presence of CD3NK1.1+NKp46+CD122+ NK cells. Absolute numbers of total CD3NK1.1+NKp46+CD122 NK cells were then calculated based on the gating strategy shown. Bars in the graph show means ± SD of replicates (n = 8–14); the fold reduction is indicated to the right. Asterisks indicate statistically significant differences (unpaired t test: **p < 0.01).
FIGURE 2.
FIGURE 2.
DX5high Eomeshigh NK cells are most affected by E4BP4 deficiency. Expression of CD127 and DX5 on NK cells (CD3NK1.1+NKp46+CD122+) in wt and E4BP4−/− thymus (A), spleen (D), and liver (G). Absolute numbers of CD127+ and DX5high NK cells were determined, and fold reduction was indicated for the liver (G). In (A), a plot from pregated CD3+ T cells (in blue) was overlaid onto the NK cells (in red) to distinguish DX5high and DX5low NK populations from DX5 T cells. (B, E, and H) Levels of Eomes expression were determined by intracellular staining in the CD127+ and the DX5high NK subsets. Mean fluorescence intensity values for Eomes (B, E, and H) and for TRAIL (H) are also shown. (C) Expression of the transcription factor T-bet in wt and E4BP4−/− thymic NK subsets. (F) Quantification of TRAIL expression on splenic NK subsets. (I) Eomes expression on TRAIL+ and DX5+ liver NK cell subsets. wt (black line); E4BP4−/− (dashed line). Data are representative of at least four experiments. Error bars indicate SD. **p < 0.01, *p < 0.05. ns, not significant.
FIGURE 3.
FIGURE 3.
Differentiation of NK cells from thymocytes is E4BP4 independent. Differentiation of NK cells from wt and E4BP4-deficient CD4CD8 DN thymocytes or BM precursors. (A) LinCD3CD4CD8 DN cells were sorted from wt, and E4BP4-deficient thymi or (B) lin precursors (CD11bCD11cCD19Ter119Ly6GCD8αCD3eCD45RNK1.1CD122) were sorted from BM. After 14 d of culture on OP9 feeder cells, NK cells were identified by FACS as CD3CD19NK1.1+NKp46+ cells (A, B). (C) Kinetic of NK cell development from DN or BM precursors. A single time course experiment is shown in the left panels; data for days 6 and 10 pooled from three experiments are shown in the right panels. (D) Kinetics of phenotypic maturation of DN-derived NK cells in vitro. (E) The frequency of NK precursors in total linCD3CD4CD8 DN thymocytes or DN subsets was determined by limiting dilution analysis. Sorted cells were plated out at frequencies varying from 30 to 3000 cells/well, and frequencies of NK cell–positive and –negative wells were used to calculate precursor frequencies in the cell subsets used. Data from four experiments were pooled for this analysis. (F) Cytokine induced IFN-γ production by CD3NKp46+NK1.1+ NK cells derived in vitro from wt or E4BP4-deficient DN thymocytes. After 14 d of culture, NK cells were incubated for 16 h with the indicated cytokines, and IFN-γ production was measured by intracellular cytokine staining. Error bars indicate the SD of replicates (unpaired t test: *p < 0.05, **p < 0.01). ns, not significant.
FIGURE 4.
FIGURE 4.
Efficient development of NK cells in E4BP4/Rag-1 DKO mice. (A) Total live thymocytes from Rag-1–deficient or DKO mice were analyzed by FACS for the frequency of NK cells (CD3NK1.1+NKp46+122+). (B) Absolute numbers of total (CD3NK1.1+CD122+NKp46+) NK cells in the thymus in a representative experiment of five are shown. (C) FACS analysis of Eomes levels in thymic CD127+DX5low [R1 in (A)] and DX5high [R2 in (A)] cells from wt (filled histogram), Rag-deficient (black line), and DKO (dashed line) mice. Overlays of single samples and quantification are shown. Total live splenocytes (D, E) and liver lymphocytes (G, H) from wt, Rag-1–deficient, or DKO mice were analyzed to determine the frequency and absolute numbers of NK cells. (F and I) FACS analysis and quantification of Eomes levels in CD127+DX5low and CD127DX5high NK cells from wt (filled histogram), Rag deficient (black line), and DKO (dashed line). Error bars indicate the SD of replicates (unpaired t test: *p < 0.05). ns, not significant.
FIGURE 5.
FIGURE 5.
Functionality and origin of NK cells in E4BP4/Rag-1 DKO mice. (A) Total live splenocytes from wt, Rag-1–deficient, or DKO mice were exposed for 16 h to the indicated cytokines in the presence of brefeldin A, and IFN-γ production by NK cells was measured by intracellular cytokine staining (n = 3). Data shown are representative of three similar experiments. (B) Splenic wt and E4BP4−/− NK cells were activated for 12 h with plate-bound anti-NK1.1 or anti-NKp46 Abs and evaluated for IFN-γ production and degranulation (as determined by CD107a expression). Results are representative of three independent experiments. For cytotoxicity, NK cells were mixed at the indicated ratio with YAC-1 target cells, and specific lysis was determined by net lactate dehydrogenase release from target cells. (C) Lungs from uninfected (−), 3-d, or 5-d influenza-infected mice of indicated genotypes were prepared for enumeration of total and IFN-γ+ NK cells by flow cytometry. (D) Determination of the frequency of NK precursors in total linCD3CD4CD8 DN1 thymocytes by limiting dilution analysis. Sorted cells were plated at frequencies varying from 30 to 3000 cells/well, and numbers of NK cell–positive and –negative wells were used to calculate precursor frequencies. Data from three experiments were pooled for this analysis. (E) Lineage-depleted BM from the indicated mice was cultured first for 5 d in SCF, Flt3L, and IL-7 and then for 7 d in IL-15 with OP9 stromal cells. Cells were then harvested and examined by flow cytometry, gating by scatter and on OP9-GFP–negative cells. The frequency of NK1.1+CD19 NK cells among live GFP cells is shown. Result representative of three independent experiments. (F and G) Frequency of mature CD3NK1.1+ NK cells in the BM of DKO or Rag-1–deficient control mice (Rag). Individual plots (F) and mean of three mice (G) are shown. (H) Flow cytometric quantification of frequencies of LMPP (linSca1+ckit+Flt3+CD127), CLP (linSca1intckitintFlt3+CD127+), pre-NKP (linCD27+2B4+CD127+Flt3CD122), and refined NKP (linCD27+2B4+CD127+Flt3CD122+) in BM from the indicated mice. Means of three mice are depicted. Error bars indicate SD of replicates (unpaired t test: *p < 0.05, **p < 0.01). ns, not significant.
FIGURE 6.
FIGURE 6.
E4BP4-independent NK cell development is not restricted to the thymus. (A) The wt or nude recipient mice were lethally irradiated and reconstituted with donor E4BP4/Rag-1 DKO BM cells (7 × 10⁶) by i.v. injection. Chimeric mice were maintained for 8 wk or 8 mo and analyzed by FACS for the presence of NK cells (CD3NK1.1+NKp46+122+). Absolute numbers of NK cells in the spleen and liver (A) were determined. (B) FACS quantification of numbers of CD3NK1.1+NKp46+122+ NK cells in thymus, spleen, and liver of E4BP4/Rag-1 (DKO) and E4BP4/IL-7/Rag-1 (TKO) mice. (C) Flow cytometric plots show the characterization of the CD3NK1.1+NKp46+122+ in the spleen of DKO and TKO animals. Numbers indicate the percentage of cells in the gates depicted.
FIGURE 7.
FIGURE 7.
Delayed accumulation and reduced fitness of E4BP4-deficient NK cells. (A) Mixed BM chimeras were generated by reconstituting lethally irradiated Rag-2−/−CD45.1+ mice with a mix of either 95% DKO CD45.2+:5% wt CD45.1+ or with 95% DKO CD45.2+:5% Rag-2−/−CD45.1+ BM cells. The total number of CD45.2+ DKO NK cells in thymus, spleen, and liver was determined 8 wk posttransplantation. (B) Quantification of NK cells (CD3NK1.1+NKp46+122+) in 95% DKO CD45.2+:5% Rag-2−/−CD45.1+ BM chimeras. Bars indicate the number of NK cells with Rag genotype as identified by CD45.1 expression or with DKO genotype expressing CD45.2. (C) Flow cytometric quantification of relative frequencies of DKO (CD45.2) and Rag (CD45.1) cells within the LMPP (linSca1+ckit+Flt3+CD127), CLP (linSca1intckitint Flt3+CD127+), NKP (linCD27+2B4+CD127+Flt3) populations in the BM of 95% DKO CD45.2+:5% Rag-2−/−CD45.1+ mixed BM chimeric mice. The 95% DKO: 5% Rag input is included to facilitate comparison. (D) Purified wt CD45.1 T cells were injected into Rag or DKO mice, and CD45.2+ host NK cells were quantified in the indicated organs. Fold decrease in NK cell numbers in T cell–pulsed versus nonpulsed mice is shown. (E) Purified hepatic or thymic lymphocytes from Rag-1 or E4BP4/Rag-1 DKO mice were adoptively transferred into IL2rg−/−Rag-2−/− recipients and analyzed 21 d later. Total number of CD3NK1.1+NKp46+122+ NK cells was determined in spleen and liver. Error bars indicate SD of replicates (unpaired t test: *p < 0.05, **p < 0.01. ***p < 0.001). ns, not significant.
FIGURE 8.
FIGURE 8.
Increased apoptosis and reduced responsiveness to IL-15 of E4BP4-deficient NK cells. (A) Flow cytometric analysis of splenic or liver lymphocytes cultured for 12 h in complete medium. Cells were stained for NK cell markers, the DNA dye ToPro and Annexin V. Dot plots show pregated CD3NK1.1+NKp46+DX5+CD122+ NK cells that are live (ToProAnnexin V DN) or apoptotic and dead (ToPro+Annexin V+ DP). Cells were quantified in (B). (C) Splenocytes were CFSE loaded and incubated for 3 d in complete medium in the presence or absence of IL-15. CFSElo NK cells that have undergone at least one division are shown. (D) NK cell recovery at the end of the IL-15 culture period. (E) Splenic NK cells were stained ex vivo for IL-15Rα expression. Results are representative of three experiments. Error bars indicate SD of replicates (unpaired t test: *p < 0.05, **p < 0.01). ns, not significant.
FIGURE 9.
FIGURE 9.
Increased turnover of NK cells in DKO mice. (A) Ex vivo flow cytometric analysis of EdU incorporation by NK cells after a 12-h EdU pulse in vivo. Pregated CD3NK1.1+NKp46+122+ NK cells were identified as EdU positive, as shown in (A) and quantified (B). Error bars indicate SD of replicates (unpaired t test: *p < 0.05). ns, not significant.

References

    1. Lanier L. L. 2008. Evolutionary struggles between NK cells and viruses. Nat. Rev. Immunol. 8: 259–268. - PMC - PubMed
    1. Lanier L. L. 2008. Up on the tightrope: natural killer cell activation and inhibition. Nat. Immunol. 9: 495–502. - PMC - PubMed
    1. Lee S. H., Biron C. A. 2010. Here today—not gone tomorrow: roles for activating receptors in sustaining NK cells during viral infections. Eur. J. Immunol. 40: 923–932. - PMC - PubMed
    1. Trinchieri G. 1989. Biology of natural killer cells. Adv. Immunol. 47: 187–376. - PMC - PubMed
    1. Vivier E., Raulet D. H., Moretta A., Caligiuri M. A., Zitvogel L., Lanier L. L., Yokoyama W. M., Ugolini S. 2011. Innate or adaptive immunity? The example of natural killer cells. Science 331: 44–49. - PMC - PubMed

Publication types

MeSH terms