

Dietary fucoxanthin increases metabolic rate and upregulated mRNA expressions of the PGC-1alpha network, mitochondrial biogenesis and fusion genes in white adipose tissues of mice
- PMID: 24534841
- PMCID: PMC3944525
- DOI: 10.3390/md12020964
Dietary fucoxanthin increases metabolic rate and upregulated mRNA expressions of the PGC-1alpha network, mitochondrial biogenesis and fusion genes in white adipose tissues of mice
Abstract
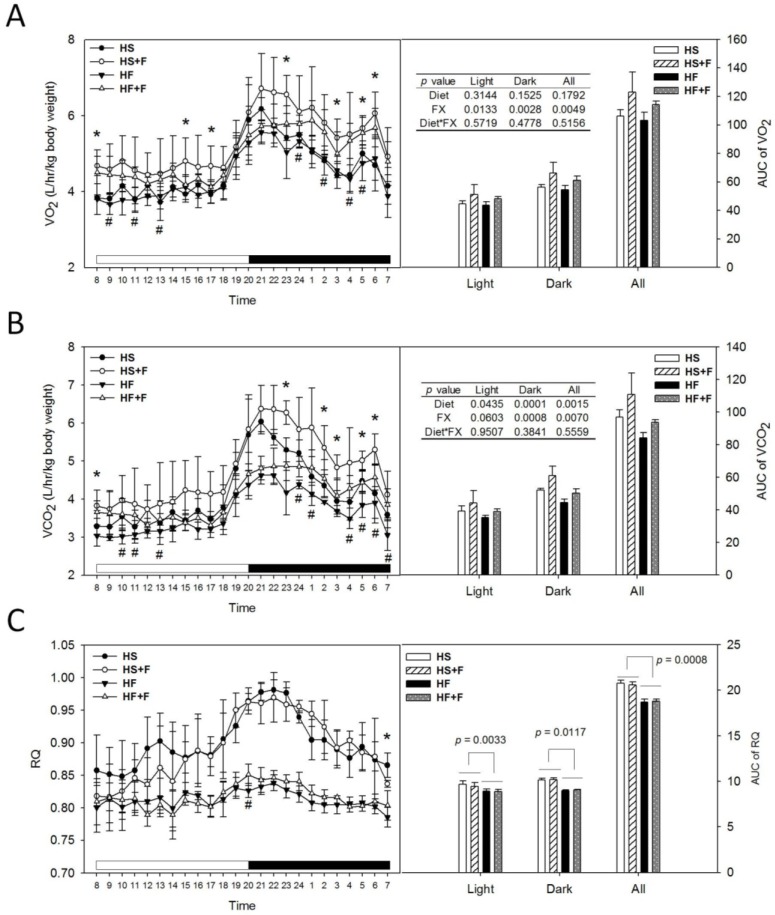
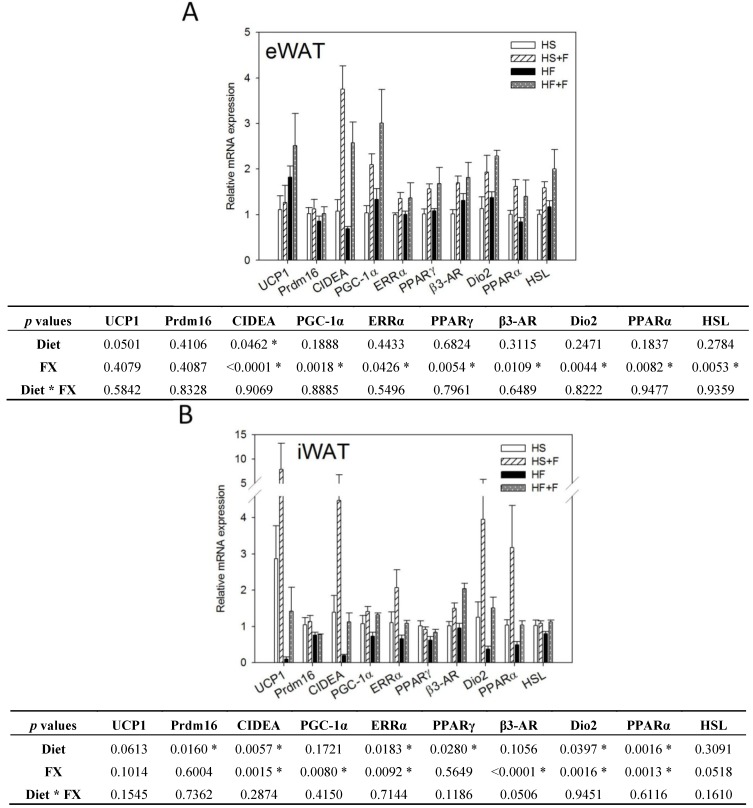
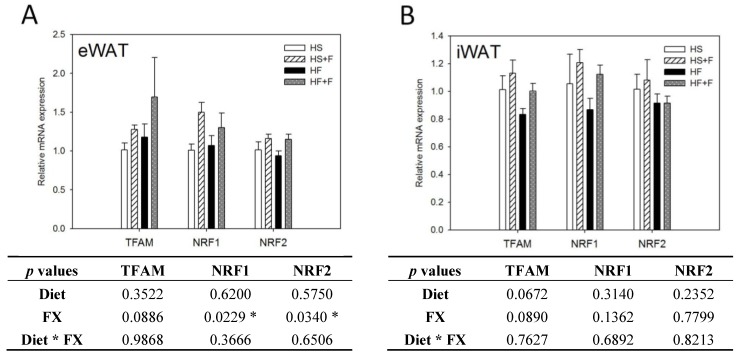
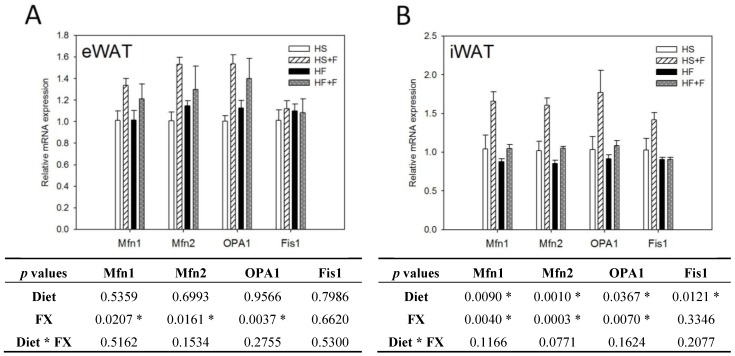
The mechanism for how fucoxanthin (FX) suppressed adipose accumulation is unclear. We aim to investigate the effects of FX on metabolic rate and expressions of genes related to thermogenesis, mitochondria biogenesis and homeostasis. Using a 2 × 2 factorial design, four groups of mice were respectively fed a high sucrose (50% sucrose) or a high-fat diet (23% butter + 7% soybean oil) supplemented with or without 0.2% FX. FX significantly increased oxygen consumption and carbon dioxide production and reduced white adipose tissue (WAT) mass. The mRNA expressions of peroxisome proliferator-activated receptor (PPAR) γ coactivator-1α (PGC-1α), cell death-inducing DFFA-like effecter a (CIDEA), PPARα, PPARγ, estrogen-related receptor α (ERRα), β3-adrenergic receptor (β3-AR) and deiodinase 2 (Dio2) were significantly upregulated in inguinal WAT (iWAT) and epididymal WAT (eWAT) by FX. Mitochondrial biogenic genes, nuclear respiratory factor 1 (NRF1) and NRF2, were increased in eWAT by FX. Noticeably, FX upregulated genes of mitochondrial fusion, mitofusin 1 (Mfn1), Mfn2 and optic atrophy 1 (OPA1), but not mitochondrial fission, Fission 1, in both iWAT and eWAT. In conclusion, dietary FX enhanced the metabolic rate and lowered adipose mass irrespective of the diet. These were associated with upregulated genes of the PGC-1α network and mitochondrial fusion in eWAT and iWAT.
Figures

Similar articles
-
The diabetes medication canagliflozin promotes mitochondrial remodelling of adipocyte via the AMPK-Sirt1-Pgc-1α signalling pathway.Adipocyte. 2020 Dec;9(1):484-494. doi: 10.1080/21623945.2020.1807850. Adipocyte. 2020. PMID: 32835596 Free PMC article.
-
PGC-1α is required for exercise- and exercise training-induced UCP1 up-regulation in mouse white adipose tissue.PLoS One. 2013 May 22;8(5):e64123. doi: 10.1371/journal.pone.0064123. Print 2013. PLoS One. 2013. PMID: 23717545 Free PMC article.
-
Regulation of Brown and White Adipocyte Transcriptome by the Transcriptional Coactivator NT-PGC-1α.PLoS One. 2016 Jul 25;11(7):e0159990. doi: 10.1371/journal.pone.0159990. eCollection 2016. PLoS One. 2016. PMID: 27454177 Free PMC article.
-
[Metabolic Alteration in Aging Process: Metabolic Remodeling in White Adipose Tissue by Caloric Restriction].Yakugaku Zasshi. 2020;140(3):383-389. doi: 10.1248/yakushi.19-00193-2. Yakugaku Zasshi. 2020. PMID: 32115557 Review. Japanese.
-
Contribution of PGC-1α to Obesity- and Caloric Restriction-Related Physiological Changes in White Adipose Tissue.Int J Mol Sci. 2021 Jun 2;22(11):6025. doi: 10.3390/ijms22116025. Int J Mol Sci. 2021. PMID: 34199596 Free PMC article. Review.
Cited by
-
Potential Usefulness of a Wakame/Carob Functional Snack for the Treatment of Several Aspects of Metabolic Syndrome: From In Vitro to In Vivo Studies.Mar Drugs. 2018 Dec 17;16(12):512. doi: 10.3390/md16120512. Mar Drugs. 2018. PMID: 30562926 Free PMC article.
-
Fucoxanthin and Polyunsaturated Fatty Acids Co-Extraction by a Green Process.Molecules. 2018 Apr 11;23(4):874. doi: 10.3390/molecules23040874. Molecules. 2018. PMID: 29641444 Free PMC article.
-
Natural bioactive compounds and their mechanisms of action in the management of obesity: a narrative review.Front Nutr. 2025 Jun 26;12:1614947. doi: 10.3389/fnut.2025.1614947. eCollection 2025. Front Nutr. 2025. PMID: 40642166 Free PMC article. Review.
-
Fucoxanthin: A Promising Phytochemical on Diverse Pharmacological Targets.Front Pharmacol. 2022 Aug 2;13:929442. doi: 10.3389/fphar.2022.929442. eCollection 2022. Front Pharmacol. 2022. PMID: 35983376 Free PMC article. Review.
-
Fucoxanthin Enhances Chain Elongation and Desaturation of Alpha-Linolenic Acid in HepG2 Cells.Lipids. 2015 Oct;50(10):945-53. doi: 10.1007/s11745-015-4059-z. Epub 2015 Aug 14. Lipids. 2015. PMID: 26271617
References
-
- Bach D., Pich S., Soriano F.X., Vega N., Baumgartner B., Oriola J., Daugaard J.R., Lloberas J., Camps M., Zierath J.R., et al. Mitofusin-2 determines mitochondrial network architecture and mitochondrial metabolism. A novel regulatory mechanism altered in obesity. J. Biol. Chem. 2003;278:17190–17197. - PubMed
Publication types
MeSH terms
Substances
LinkOut - more resources
Full Text Sources
Other Literature Sources
Research Materials
