Satiety mechanisms in genetic risk of obesity
- PMID: 24535189
- PMCID: PMC3981891
- DOI: 10.1001/jamapediatrics.2013.4944
Satiety mechanisms in genetic risk of obesity
Abstract
Importance: A better understanding of the cause of obesity is a clinical priority. Obesity is highly heritable, and specific genes are being identified. Discovering the mechanisms through which obesity-related genes influence weight would help pinpoint novel targets for intervention. One potential mechanism is satiety responsiveness. Lack of satiety characterizes many monogenic obesity disorders, and lower satiety responsiveness is linked with weight gain in population samples.
Objective: To test the hypothesis that satiety responsiveness is an intermediate behavioral phenotype associated with genetic predisposition to obesity in children.
Design, setting, and participants: Cross-sectional observational study of a population-based cohort of twins born January 1, 1994, to December 31, 1996 (Twins Early Development Study). Participants included 2258 unrelated children (53.3% female; mean [SD] age, 9.9 [0.8] years), one randomly selected from each twin pair.
Exposure: Genetic predisposition to obesity. We created a polygenic risk score (PRS) comprising 28 common obesity-related single-nucleotide polymorphisms identified in a meta-analysis of obesity-related genome-wide association studies.
Main outcomes and measures: Satiety responsiveness was indexed with a standard psychometric scale (Child Eating Behavior Questionnaire). Using 1990 United Kingdom reference data, body mass index SD scores and waist SD scores were calculated from parent-reported anthropometric data for each child. Information on satiety responsiveness, anthropometrics, and genotype was available for 2258 children. We examined associations among the PRS, adiposity, and satiety responsiveness.
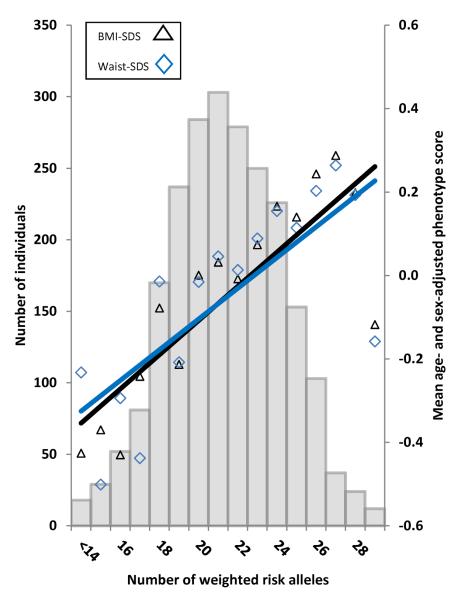
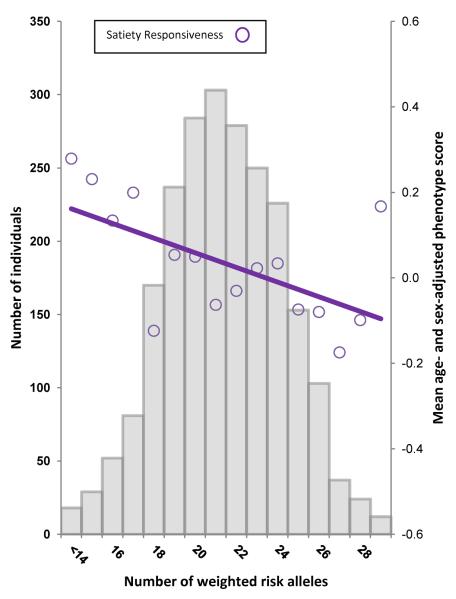
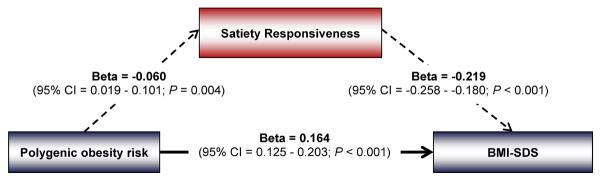
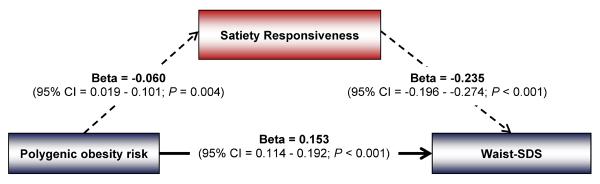
Results: The PRS was negatively related to satiety responsiveness (β coefficient, -0.060; 95% CI, -0.019 to -0.101) and positively related to adiposity (β coefficient, 0.177; 95% CI, 0.136-0.218 for body mass index SD scores and β coefficient, 0.167; 95% CI, 0.126-0.208 for waist SD scores). More children in the top 25% of the PRS were overweight than in the lowest 25% (18.5% vs 7.2%; odds ratio, 2.90; 95% CI, 1.98-4.25). Associations between the PRS and adiposity were significantly mediated by satiety responsiveness (P = .006 for body mass index SD scores and P = .005 for waist SD scores).
Conclusions and relevance: These results support the hypothesis that low satiety responsiveness is one of the mechanisms through which genetic predisposition leads to weight gain in an environment rich with food. Strategies to enhance satiety responsiveness could help prevent weight gain in genetically at-risk children.
Figures
Comment in
-
Appetite for prevention: genetics and developmental epidemiology join forces in obesity research.JAMA Pediatr. 2014 Apr;168(4):309-11. doi: 10.1001/jamapediatrics.2013.5291. JAMA Pediatr. 2014. PMID: 24535111 Free PMC article. No abstract available.
-
Obesity: Genes and a hearty appetite conspire to increase childhood obesity risk.Nat Rev Endocrinol. 2014 Apr;10(4):187. doi: 10.1038/nrendo.2014.24. Epub 2014 Mar 4. Nat Rev Endocrinol. 2014. PMID: 24590186 No abstract available.
References
-
- Maes HH, Neale MC, Eaves LJ. Genetic and environmental factors in relative body weight and human adiposity. Behav Genet. 1997;27:325–351. - PubMed
Publication types
MeSH terms
Grants and funding
- G0500079(73692)/MRC_/Medical Research Council/United Kingdom
- 14133/CRUK_/Cancer Research UK/United Kingdom
- R01 HD059215/HD/NICHD NIH HHS/United States
- G0901245/MRC_/Medical Research Council/United Kingdom
- HD044454/HD/NICHD NIH HHS/United States
- G19/2/MRC_/Medical Research Council/United Kingdom
- R01 HD044454/HD/NICHD NIH HHS/United States
- WT_/Wellcome Trust/United Kingdom
- 085475/Z/08/Z/WT_/Wellcome Trust/United Kingdom
- D19086/BB_/Biotechnology and Biological Sciences Research Council/United Kingdom
- G0500079/MRC_/Medical Research Council/United Kingdom
- HD059215/HD/NICHD NIH HHS/United States
LinkOut - more resources
Full Text Sources
Other Literature Sources
Medical