. 2013 Nov 12;3(4):1445-60.
doi: 10.3390/brainsci3041445.

Development of Brain EEG Connectivity across Early Childhood: Does Sleep Play a Role?

Affiliations

Development of Brain EEG Connectivity across Early Childhood: Does Sleep Play a Role?

Salome Kurth et al. Brain Sci. .

Abstract

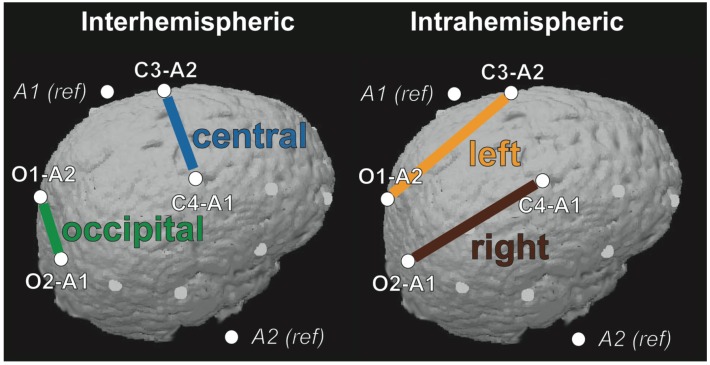
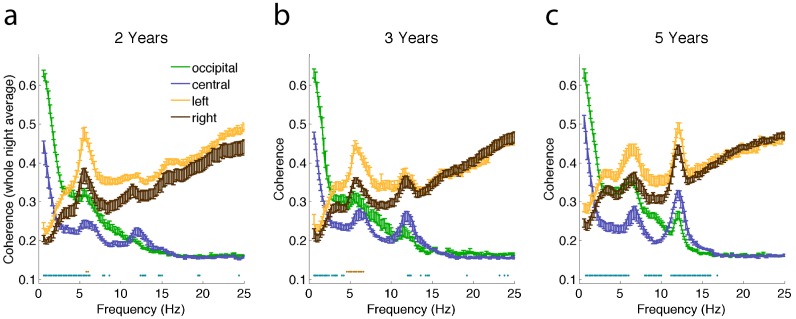
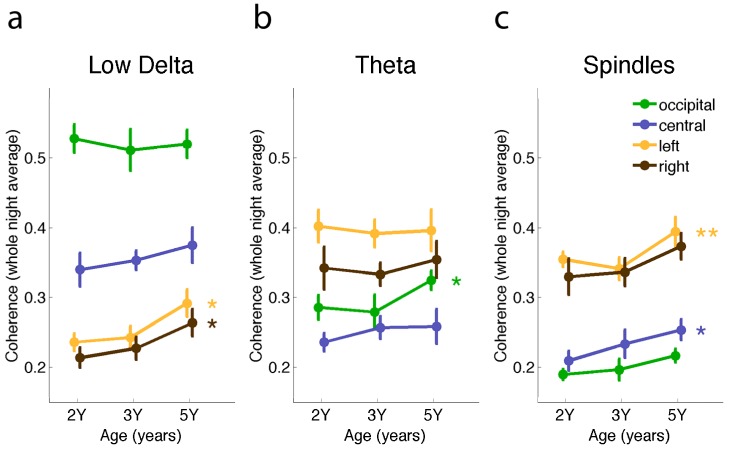
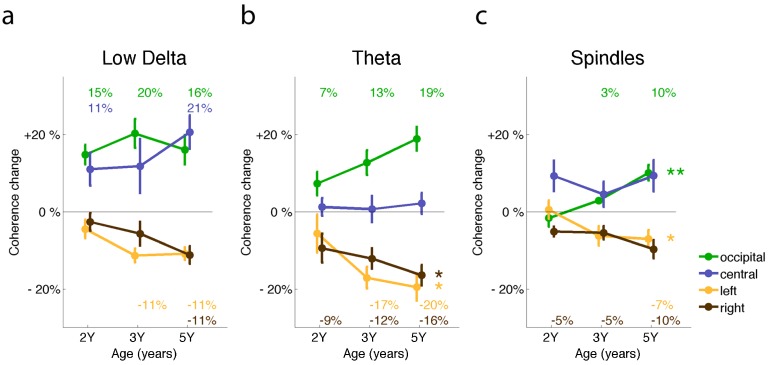
Sleep has beneficial effects on brain function and learning, which are reflected in plastic changes in the cortex. Early childhood is a time of rapid maturation in fundamental skills-e.g., language, cognitive control, working memory-that are predictive of future functioning. Little is currently known about the interactions between sleep and brain maturation during this developmental period. We propose coherent electroencephalogram (EEG) activity during sleep may provide unique insight into maturational processes of functional brain connectivity. Longitudinal sleep EEG assessments were performed in eight healthy subjects at ages 2, 3 and 5 years. Sleep EEG coherence increased across development in a region- and frequency-specific manner. Moreover, although connectivity primarily decreased intra-hemispherically across a night of sleep, an inter-hemispheric overnight increase occurred in the frequency range of slow waves (0.8-2 Hz), theta (4.8-7.8 Hz) and sleep spindles (10-14 Hz), with connectivity changes of up to 20% across a night of sleep. These findings indicate sleep EEG coherence reflects processes of brain maturation-i.e., programmed unfolding of neuronal networks-and moreover, sleep-related alterations of brain connectivity during the sensitive maturational window of early childhood.

Keywords: children; coherence; development; early childhood; maturation; sleep EEG.


Figures

Figure 1
Figure 1
Coherence was derived from inter-hemispheric (left panel), central (C4A1-C3A2) and occipital (O2A1-O1A2) EEG derivations and from intra-hemispheric derivations (right panel) in the left (C3A2-O1A2) and right (C4A1-O2A1) hemisphere.
Figure 2
Figure 2
Average all-night coherence spectra [non-rapid eye movement (non-REM) sleep stages N2–N4, artifact free epochs only]. Dots refer to significant differences between inter-hemispheric coherence spectra (occipital vs. central, green), and intra-hemispheric coherence (left vs. right hemisphere, brown) using bootstrap statistics for each 0.2 Hz bin (p < 0.05). Fisher’s z-transformation was applied to the square root of coherence values for statistical analysis. Back-transformed, squared data are plotted (applies for all subsequent figures). (a) 2 Years; (b) 3 Years; and (c) 5 Years.
Figure 3
Figure 3
Development of sleep EEG coherence is region- and frequency-specific. Coherence data (inter-hemispheric “occipital” and “central”; intra-hemispheric “left” and “right”) were averaged for the whole night (mean ± SEM). Repeated measures ANOVA reached significance in the “left” and “right” hemisphere for low-delta coherence, inter-hemispheric “occipital” areas for theta and inter-hemispheric “central” areas and in the “left” hemisphere for spindle coherence, as indicated with asterisks (* p < 0.05; ** p < 0.01). Post-hoc two-tailed paired t-tests revealed developmental differences mainly between 2Y–5Y (see text for details). In subsequent analysis, frequency bands were defined as (a) low-delta (0.8–2 Hz); (b) theta (4.8–7.8 Hz); and (c) sleep spindles (10–14 Hz).
Figure 4
Figure 4
Temporal dynamics of coherence across the night presented for the frequency bands (a) low-delta (0.8–2 Hz), (b) theta (4.8–7.8 Hz) and (c) sleep spindles (10–14 Hz). First and last non-REM sleep episodes were compared (percentage change relative to first episode). Positive values reflect an increase across sleep, negative values a decrease (* p < 0.05; ** p < 0.01, repeated measures ANOVA, factor “age”). For data points that underwent a significant change across the night (i.e., different from zero, p < 0.05, post hoc paired two-tailed t-test), the percentage of change is indicated in the corresponding color.

References

    1. Deoni S.C., Dean D.C., III, O’Muircheartaigh J., Dirks H., Jerskey B.A. Investigating white matter development in infancy and early childhood using myelin water faction and relaxation time mapping. Neuroimage. 2012;63:1038–1053. doi: 10.1016/j.neuroimage.2012.07.037. - DOI - PMC - PubMed
    1. Huttenlocher P.R. Synaptic density in human frontal cortex—Developmental changes and effects of aging. Brain Res. 1979;163:195–205. doi: 10.1016/0006-8993(79)90349-4. - DOI - PubMed
    1. Achermann P., Borbely A.A. Temporal evolution of coherence and power in the human sleep electroencephalogram. J. Sleep Res. 1998;7:36–41. doi: 10.1046/j.1365-2869.7.s1.6.x. - DOI - PubMed
    1. Tarokh L., Carskadon M.A., Achermann P. Developmental changes in brain connectivity assessed using the sleep EEG. Neuroscience. 2010;171:622–634. doi: 10.1016/j.neuroscience.2010.08.071. - DOI - PMC - PubMed
    1. Frank M.G., Issa N.P., Stryker M.P. Sleep enhances plasticity in the developing visual cortex. Neuron. 2001;30:275–287. doi: 10.1016/S0896-6273(01)00279-3. - DOI - PubMed

LinkOut - more resources