

Comment
doi: 10.1634/theoncologist.2013-0383.
Were our estimates of overdiagnosis with mammography screening in the United States "based on faulty science"?
Affiliations
- PMID: 24536052
- PMCID: PMC3926797
- DOI: 10.1634/theoncologist.2013-0383
Item in Clipboard
Comment
Were our estimates of overdiagnosis with mammography screening in the United States "based on faulty science"?
Oncologist.
2014 Feb.
Abstract
The author responds to criticisms that his and his coauthor’s estimates of overdiagnoses with mammography screening are “based on faulty science” by reviewing the statistical analyses and comparing global data with those of Connecticut.
Conflict of interest statement
Disclosures of potential conflicts of interest may be found at the end of this article.
Figures

Annual incidence of early- and late-stage breast cancer in women younger
than 40 years of age, 1976–2010, Surveillance, Epidemiology, and
End Results 9 (lower panel reproduced from Figure 1 of Bleyer and Welch [2] with 2009 and 2010 data added, in brackets) and in women
35 to 39 years of age at diagnosis (upper panel). The straight red lines
are linear regressions of the late-stage incidence for 1980–2010.
Lower panel from New England Journal of Medicine, A Bleyer, HG Welch,
“Effect of three decades of screening mammography on
breast-cancer incidence”, 2012;367:1998–2005. Copyright
© 2012 Massachusetts Medical Society. Reprinted with
permission.

Annual incidence of common cancers in women 40 years of age and older in
Connecticut, 1973–2010. The solid blue lines are linear regressions
(with lung cancer an exception) of incidence rates during 1935–1973.
The dotted blue lines are projections to 2010 of the trend prior to 1973.
The solid brown lines are linear regressions of the Surveillance,
Epidemiology, and End Results (SEER) 1973–2010 era.

Annual incidence of breast cancer in 35- to 39- and 40- to 44-year-old women,
1973–2010, Surveillance, Epidemiology, and End Results 9. Dotted
curves indicate invasive cancer and solid curves indicate all cancer,
including in situ.
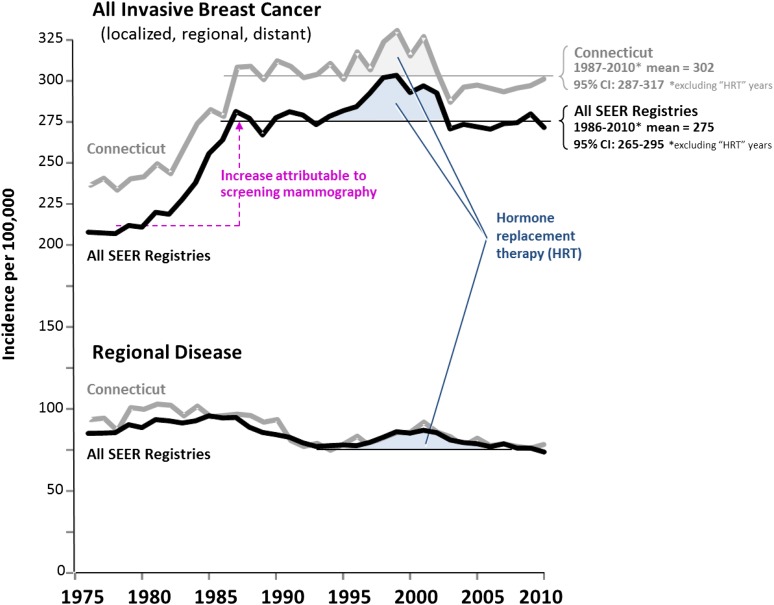
Steady state incidence since 1990 in invasive breast cancer not due to
hormone-replacement therapy (HRT) in women 40 years of age and older in
Connecticut and in Surveillance, Epidemiology, and End Results (SEER) 9. The
bold curves designate all nine SEER registries; the lighter curves represent
Connecticut. Horizontal lines indicate mean value after impact on incidence
stabilized and “HRT years” are excluded.
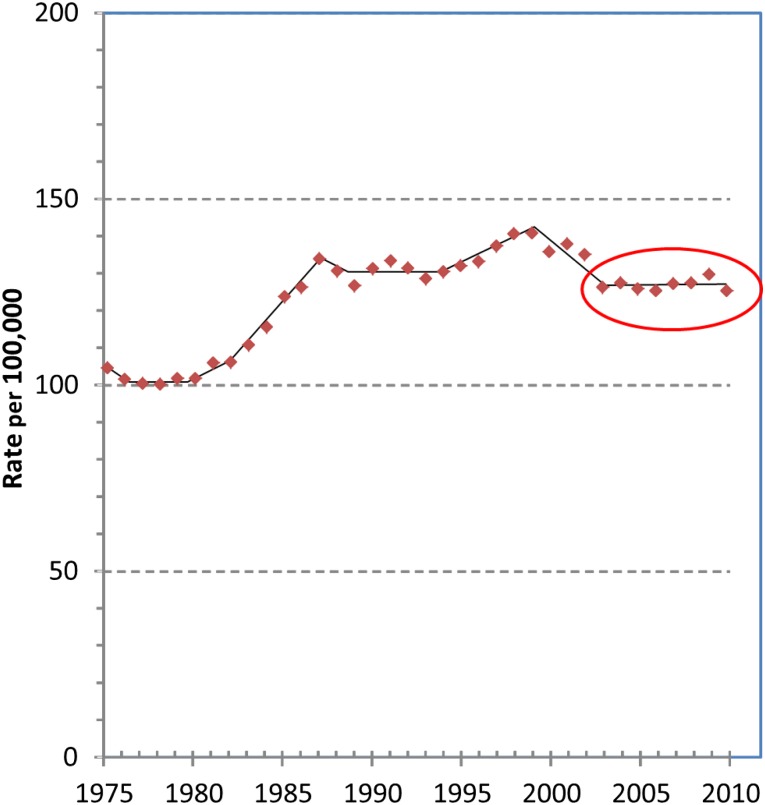
Annual incidence of invasive breast cancer in women of all ages,
1975–2010, Surveillance, Epidemiology, and End Results (SEER) 9.
Adapted from age-adjusted SEER incidence of breast cancer 1975–2010
(figure in [1]), with an additional
year (2010) of data from SEER added. The circled area designates the change
in incidence, or lack thereof, of invasive breast cancer incidence during
2003–2010.

Breast cancer incidence in SEER 9 registries since 1976. Upper panel:
Increase in annual incidence of in situ and localized breast cancer from
prescreening mammography (1976–1985) to postscreening steady state
(1995–2010), age 40 and older. Lower panel: Average annual percentage
change (AAPC) in breast cancer incidence 1976–2010 among women 35 to
39 years of age.
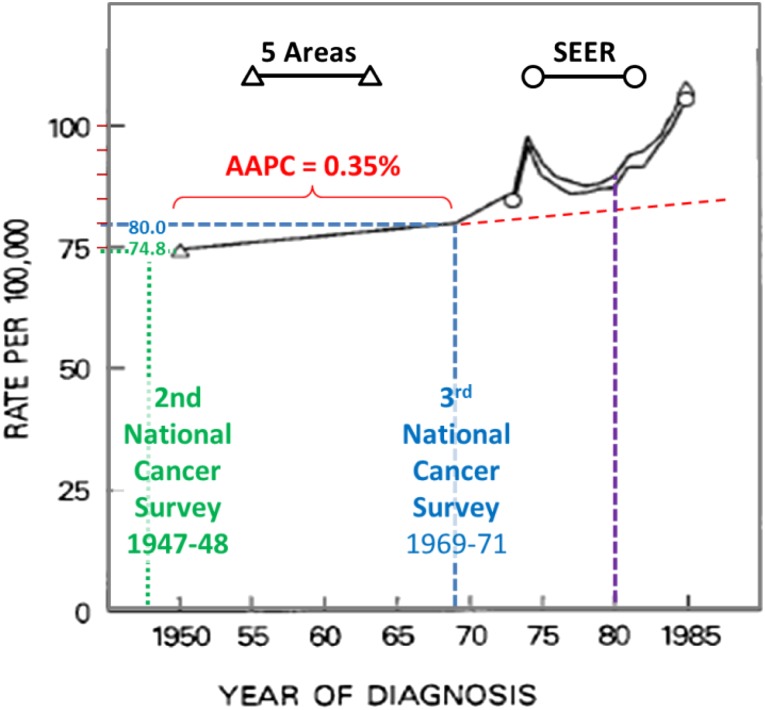
Incidence of breast cancer in white females from 1950 to 1985 according to
five areas and Surveillance, Epidemiology, and End Results (SEER) 9 data.
All black elements are from the original figure in Kessler et al. [17].
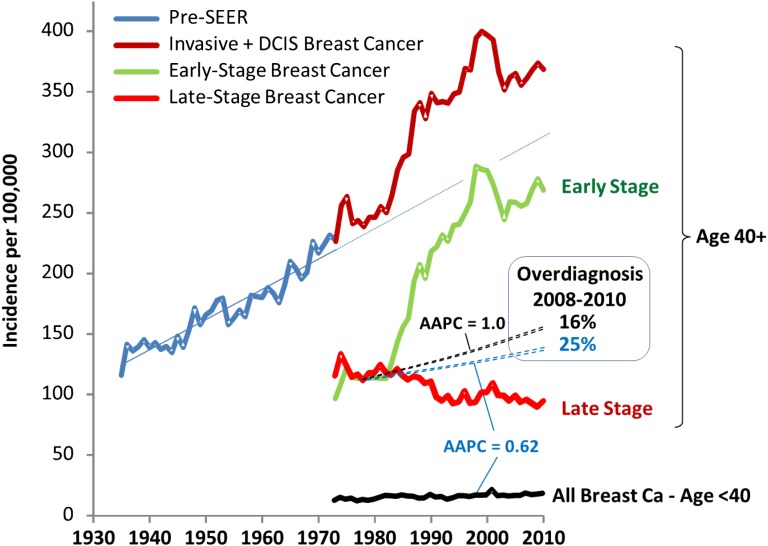
Annual breast cancer incidence in women in Connecticut of age 40 and older
since 1935 [8] and by extent of
disease at diagnosis and of age younger than 40 years of age after 1973 when
Connecticut became a Surveillance, Epidemiology, and End Results (SEER)
site. Abbreviation: DCIS, ductal carcinoma in situ.

Cumulative number of women diagnosed with early- and late-stage breast cancer
since 1979, age 40 and older, Surveillance, Epidemiology, and End Results
9.
Comment in
-
Overdiagnosing overdiagnosis.Oncologist. 2014 Feb;19(2):103-6. doi: 10.1634/theoncologist.2014-0036. Oncologist. 2014. PMID: 24536050 Free PMC article.
Comment on
-
Arguments against mammography screening continue to be based on faulty science.Oncologist. 2014 Feb;19(2):107-12. doi: 10.1634/theoncologist.2013-0184. Oncologist. 2014. PMID: 24536051 Free PMC article.
References
-
- Bleyer A, Welch HG. Effect of three decades of screening mammography on breast-cancer incidence. N Engl J Med. 2012;367:1998–2005. - PubMed
-
- Source: Surveillance, Epidemiology, and End Results (SEER) Program ( http://www.seer.cancer.gov) SEER*Stat Database: Incidence - SEER 18 Regs Research Data + Hurricane Katrina Impacted Louisiana Cases, Nov 2012 Sub (1973–2010 varying) - Linked To County Attributes - Total U.S., 1969–2011 Counties, National Cancer Institute, DCCPS, Surveillance Research Program, Surveillance Systems Branch, released April 2013, based on the November 2012 submission.
-
- De P, Neutel CI, Olivotto I, et al. Breast cancer incidence and hormone replacement therapy in Canada. J Natl Cancer Inst. 2010;102:1489–1495. - PubMed
-
- Jørgensen KJ, Gøtzsche PD. Effect of screening mammography on breast cancer incidence. N Engl J Med. 2013;368:677–679. - PubMed
Publication types
MeSH terms
LinkOut - more resources
Full Text Sources
Other Literature Sources
Medical
