. 2014 Aug;143(4):1476-88.
doi: 10.1037/a0035813. Epub 2014 Feb 17.

Eye tracking and pupillometry are indicators of dissociable latent decision processes

Affiliations

Eye tracking and pupillometry are indicators of dissociable latent decision processes

James F Cavanagh et al. J Exp Psychol Gen. 2014 Aug.

Abstract

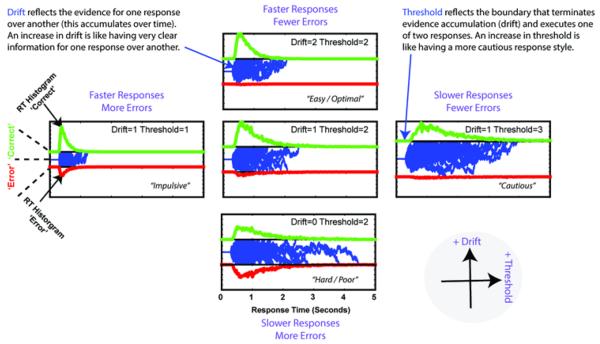
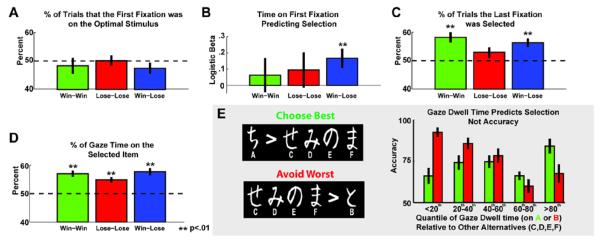
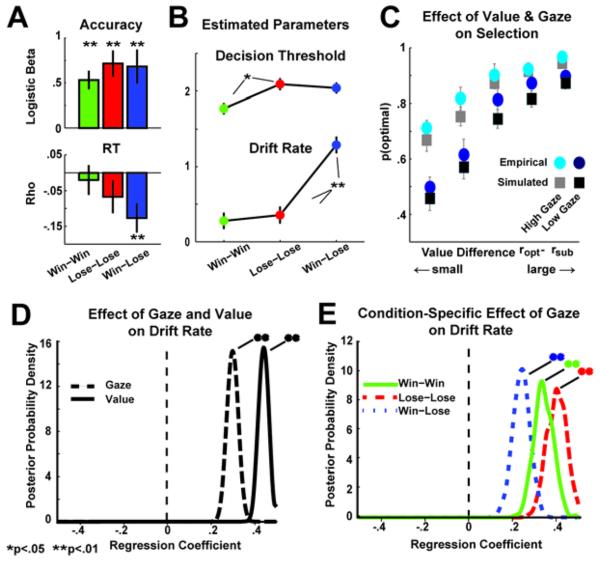
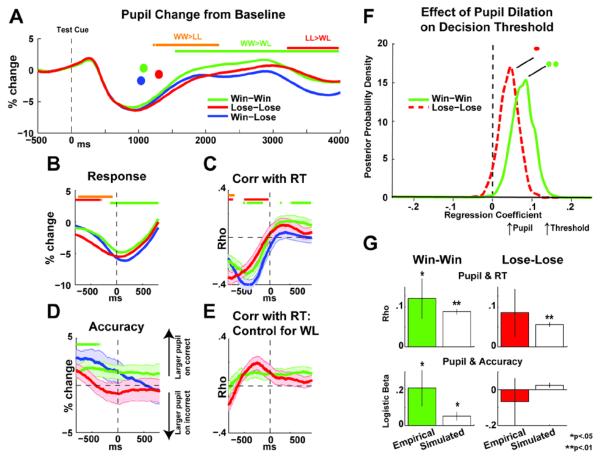
Can you predict what people are going to do just by watching them? This is certainly difficult: it would require a clear mapping between observable indicators and unobservable cognitive states. In this report, we demonstrate how this is possible by monitoring eye gaze and pupil dilation, which predict dissociable biases during decision making. We quantified decision making using the drift diffusion model (DDM), which provides an algorithmic account of how evidence accumulation and response caution contribute to decisions through separate latent parameters of drift rate and decision threshold, respectively. We used a hierarchical Bayesian estimation approach to assess the single trial influence of observable physiological signals on these latent DDM parameters. Increased eye gaze dwell time specifically predicted an increased drift rate toward the fixated option, irrespective of the value of the option. In contrast, greater pupil dilation specifically predicted an increase in decision threshold during difficult decisions. These findings suggest that eye tracking and pupillometry reflect the operations of dissociated latent decision processes.


Figures

Figure 1
Figure 1
Probabilistic value-based decision making task, psychophysiological measurement, and performance. A) During training, each stimulus pair was presented separately. Participants learned to select the better of the two options (the `winner') solely through probabilistic feedback (% reinforcement is displayed below each stimulus). During the testing phase, each option was paired with all other options and participants had to choose the best one, without the aid of feedback. Here we investigated high conflict appetitive (`win-win') and aversive (`lose-lose') and low conflict (`win-lose') conditions within the test phase. B) Example single trial data for pupil dilation and horizontal eye gaze. Gaze was quantified as a proportional value based on the percent of dwell time on the optimal stimulus until the choice. C) As in other studies of this task, participants were more accurate in the easy win-lose condition, and were slower in the aversive lose-lose condition (error bars are SEM).
Figure 2
Figure 2
Example of latent Drift Diffusion Model (DDM) parameters. Noisy sensory evidence (blue traces) accumulates towards a bound, whereupon a response is initiated. The duration and direction of these evidence accumulation processes account for the RT distributions in each of the (binary) conditions (here, correct and erroneous choices are shown). On the vertical axis, an increase in drift rate accounts for increased evidence for one response over another, leading to shorter RTs and better accuracy (bottom towards top). On the horizontal axis, and increase in decision threshold raises the boundaries for response execution, leading to longer RTs and better accuracy (left toward right).
Figure 3
Figure 3
Tests of aDDM predictions of the influence of gaze dwell time on selection. The aDDM predicts that: A) The first stimulus fixated upon should be random with respect to option value. B) The time spent viewing the first option should predict selection. C) The final item fixated upon should be more likely to be selected. D) The relative amount of time gazing on an option should predict selection. E) A novel test of whether gaze time interacts with the value of stimuli. Quantiles reflect the amount of relative time viewing the most optimal (A) and the worst suboptimal (B) stimuli relative to other options (C,D,E,F). Relative viewing time predicted selection in both cases, resulting in improving accuracy for the optimal stimulus but decreasing accuracy for the suboptimal stimulus. Error bars are SEM.
Figure 4
Figure 4
Hierarchical Bayesian parameter estimation of the Drift Diffusion Model, with gaze time regressors on major decision parameters. A) Empirical data: relationships between gaze dwell time on the optimal stimulus with accuracy (logistic regression) and RT (Spearman's rho). Error bars are SEM. B) Estimated DDM parameters (mean +/− sd) for each condition. C) Probability of selecting the optimal choice as a function of value difference between the options, separated by conditions with high vs. low gaze durations on the optimal option. Circles are empirical choice (error bars are SEM across participants) and squares are HDDM posterior predictive simulations from the independent Model 1 (error bars are SD of posteriors). D) Bayesian posterior belief densities from the independent Model 1 of the regression coefficients for value (roptrsub) and gaze (gazeoptgazesub). E) Posterior densities of the regression coefficient of gaze on drift rate in a model estimating this effect separately for each condition. Significant effects were determined when > 95% of the posterior density exceeded 0.
Figure 5
Figure 5
Phasic pupil change and relation to decision threshold. A) Pupil change locked to the test phase presentation of choice options. The initial peak and subsequent trough are due to the pupil light reflex (~100 to 1000 ms). Dots indicate mean RTs for each condition. Horizontal bars indicate time points that were significantly different between specified conditions. B) Response-locked pupil dilation. C) Timepoint-by-timepoint Spearman's correlations between response-locked pupil dilation and RT. Error bars are SEM. D) Pupil dilation on correct minus incorrect choices. Error bars are SEM. E) Correlations as in (C), but correcting for canonical influences in high conflict conditions by subtracting low conflict correlations. F) Posterior of the regression coefficients for pupil dilation on decision threshold in the win-win and lose-lose high conflict conditions (corrected by subtracting low conflict pupil dilation). Significant effects were determined when > 95% of the posterior density exceeded 0. G) Empirical (color) and simulated posterior predictive (white) relationships between pupil dilation and performance (RT and accuracy).

References

    1. Armel KC, Beaumel A, Rangel A. Biasing simple choices by manipulating relative visual attention. Judgment and Decision Making. 2008;3(5):396–403.
    1. Aron AR, Behrens TE, Smith S, Frank MJ, Poldrack RA. Triangulating a cognitive control network using diffusion-weighted magnetic resonance imaging (MRI) and functional MRI. J Neurosci. 2007;27(14):3743–3752. doi:27/14/3743 [pii] 10.1523/JNEUROSCI.0519-07.2007. - PMC - PubMed
    1. Beatty J, Lucero-Wagoner B. The Pupillary System. In: Cacioppo JT, Tassinary LG, Berntson GG, editors. Handbook of Psychophysiology. 2nd ed. Cambridge University Press; 2000. pp. 142–162.
    1. Bogacz R, Brown E, Moehlis J, Holmes P, Cohen JD. The physics of optimal decision making: a formal analysis of models of performance in two-alternative forced-choice tasks. Psychological review. 2006;113(4):700–65. doi:10.1037/0033-295X.113.4.700. - PubMed
    1. Brisson J, Mainville M, Mailloux D, Beaulieu C, Serres J, Sirois S. Pupil diameter measurement errors as a function of gaze direction in corneal reflection eyetrackers. Behavior research methods. 2013 doi:10.3758/s13428-013-0327-0. - PubMed

Publication types