Review
. 2014 Jun:117:20-40.
doi: 10.1016/j.pneurobio.2014.02.004. Epub 2014 Feb 16.

What is normal in normal aging? Effects of aging, amyloid and Alzheimer's disease on the cerebral cortex and the hippocampus

Affiliations
Review

What is normal in normal aging? Effects of aging, amyloid and Alzheimer's disease on the cerebral cortex and the hippocampus

Anders M Fjell et al. Prog Neurobiol. 2014 Jun.

Abstract

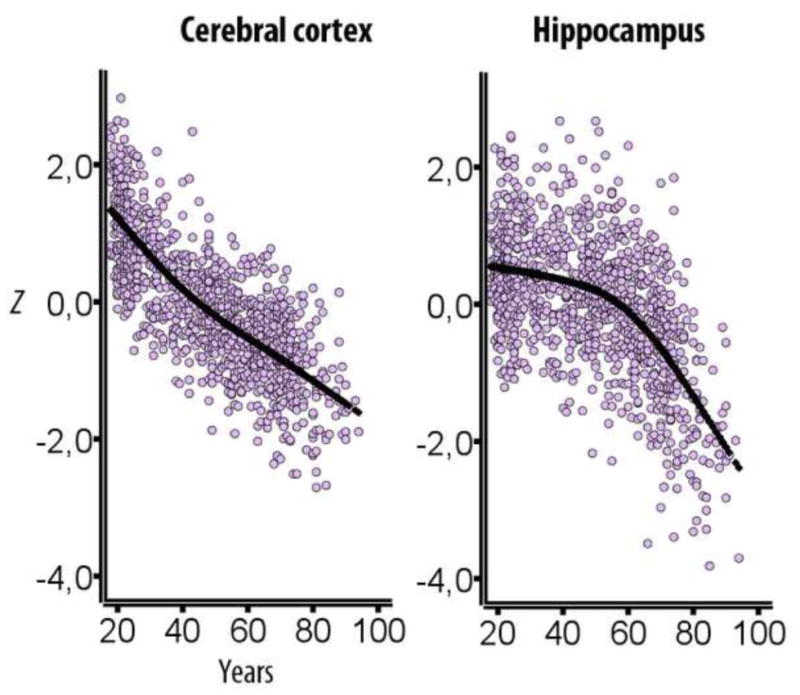
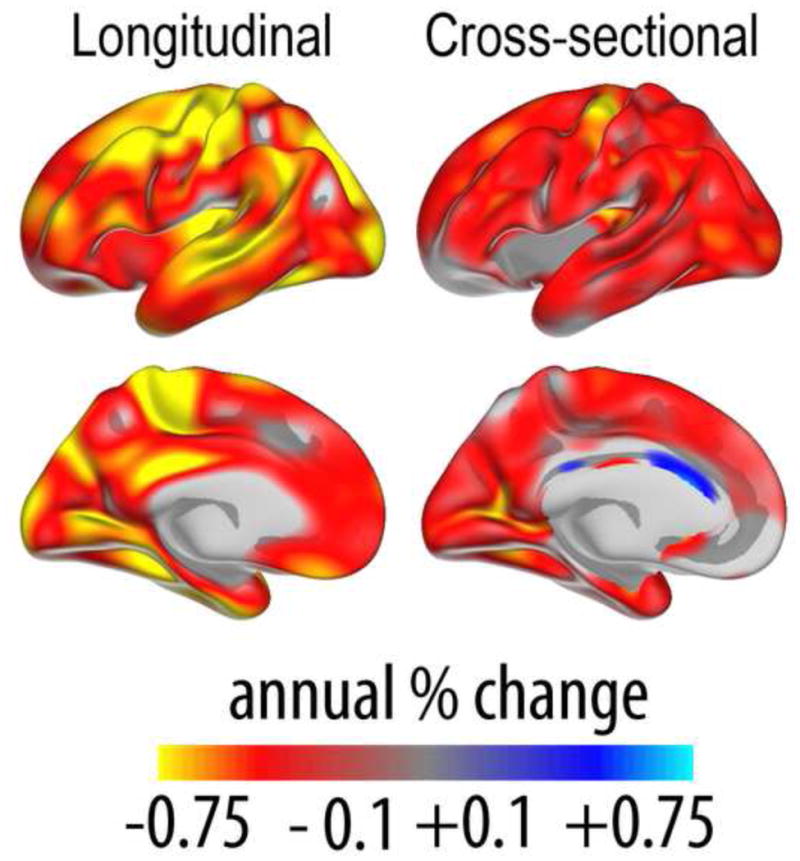
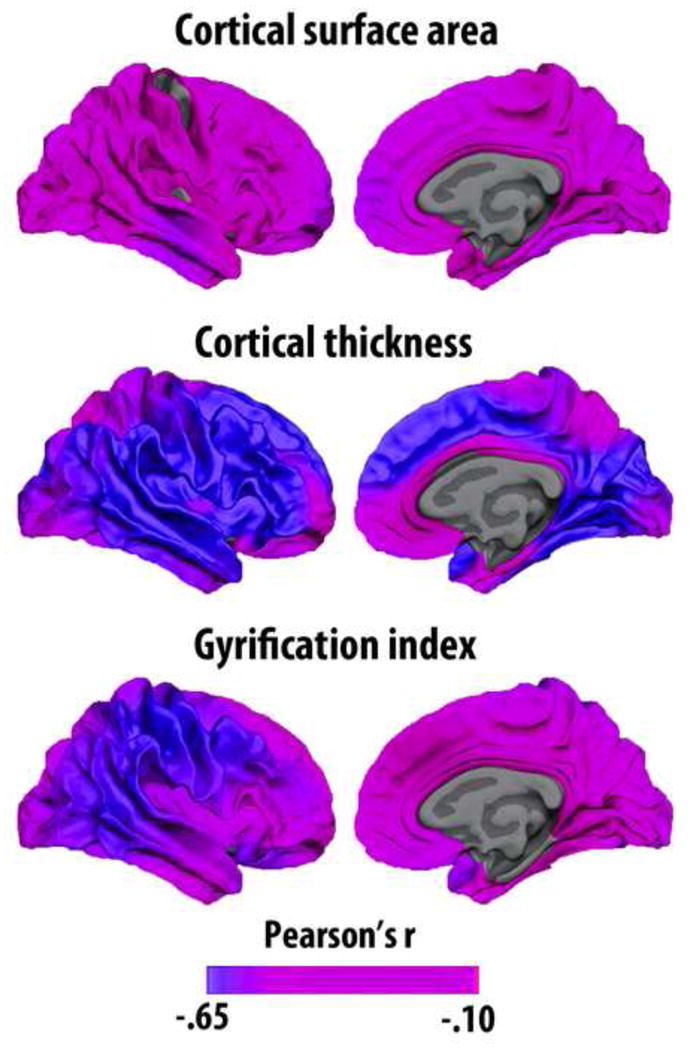
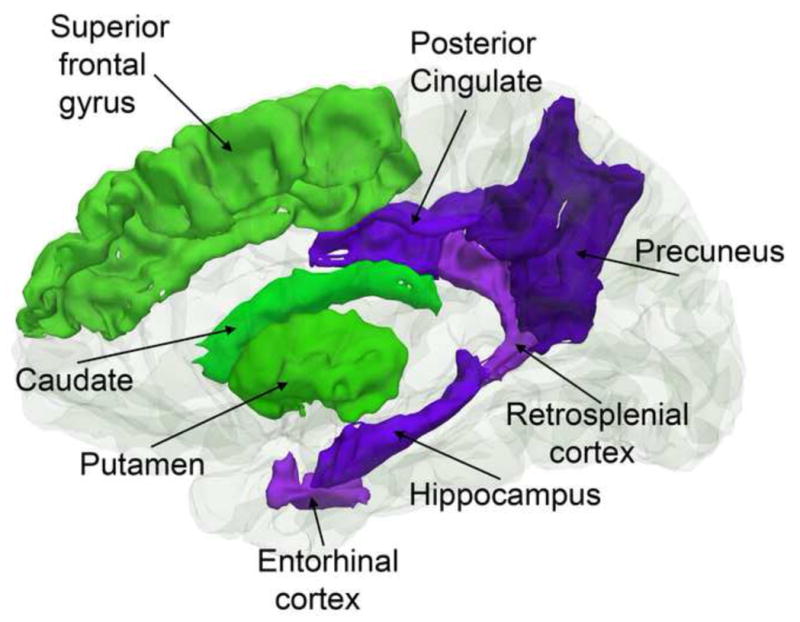
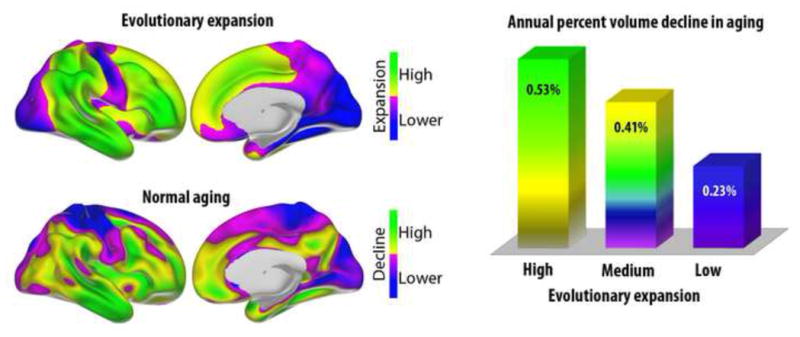
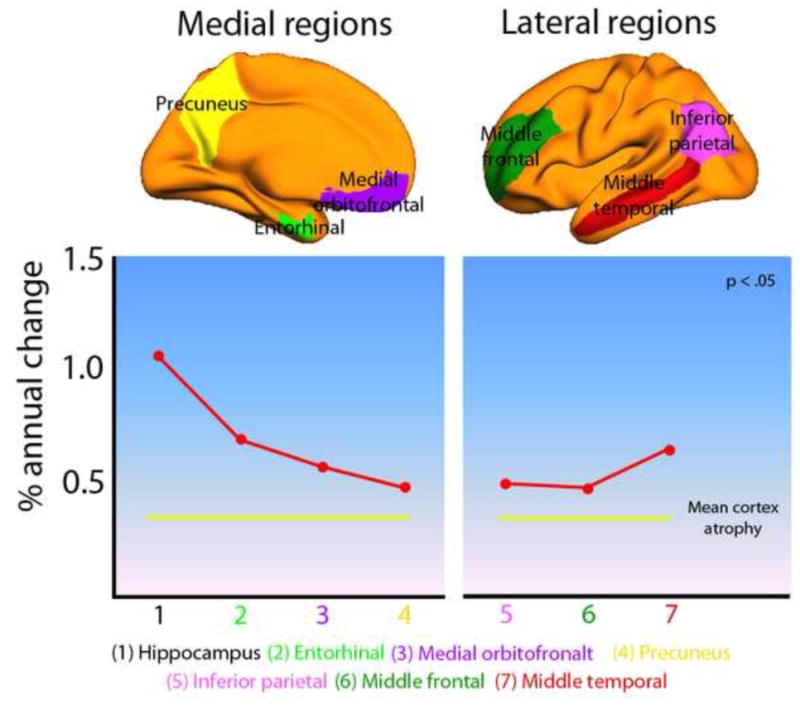
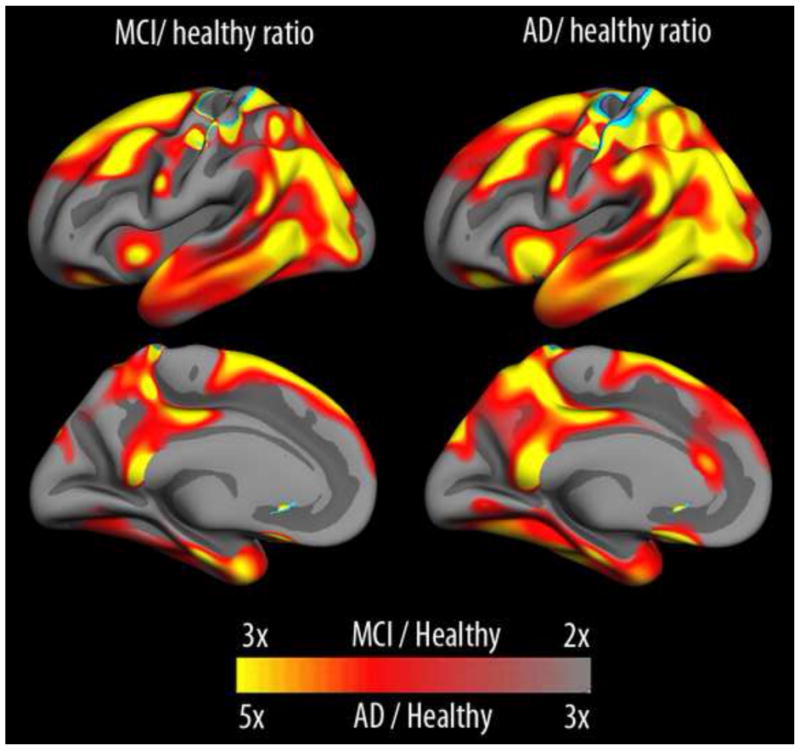
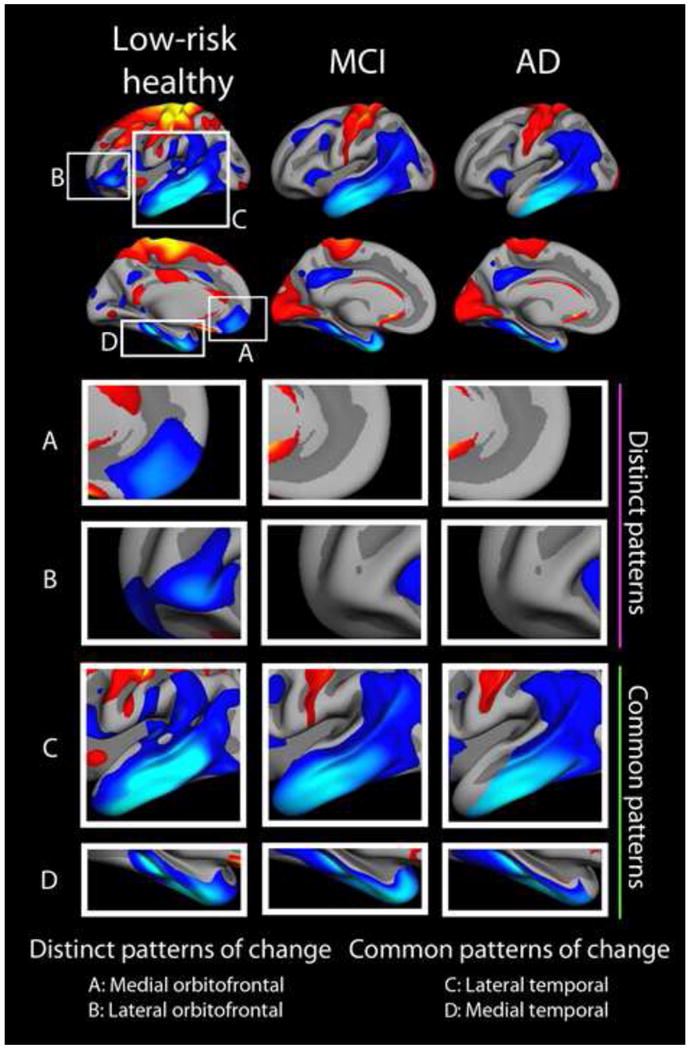
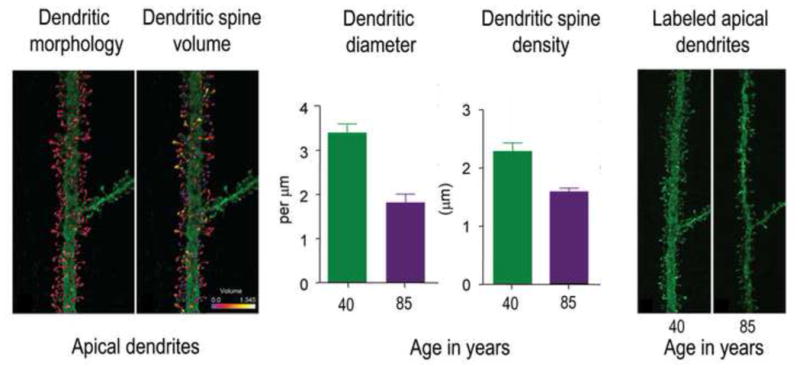
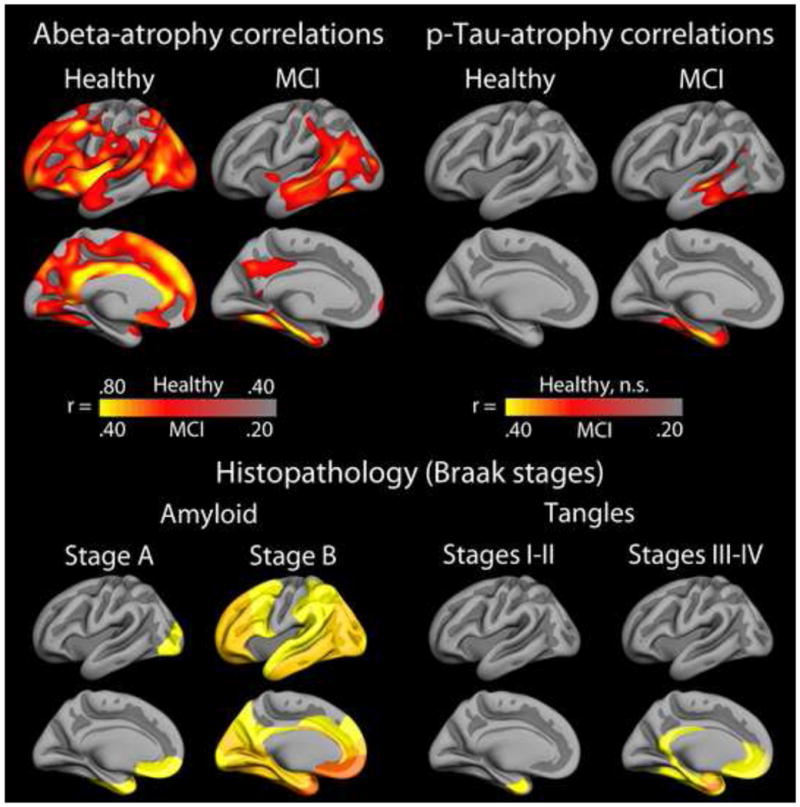
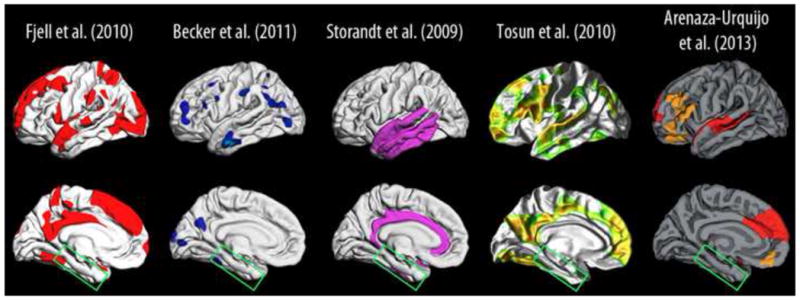
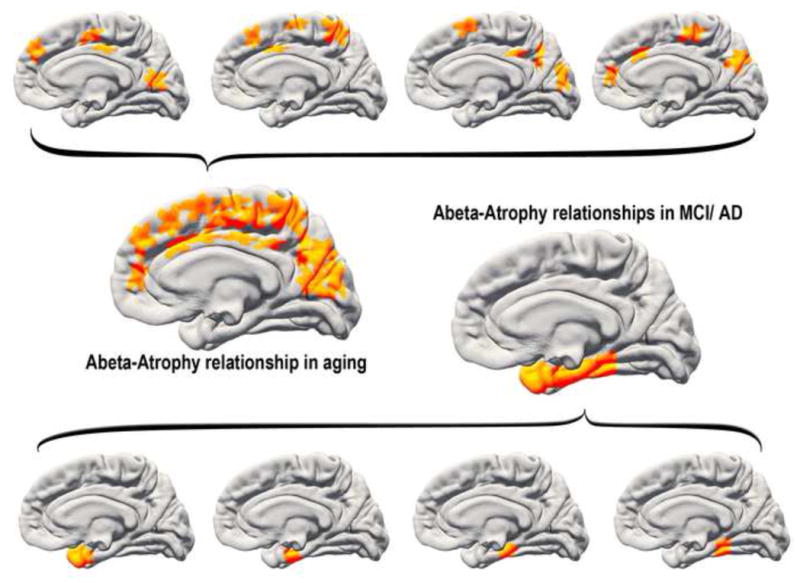
What can be expected in normal aging, and where does normal aging stop and pathological neurodegeneration begin? With the slow progression of age-related dementias such as Alzheimer's disease (AD), it is difficult to distinguish age-related changes from effects of undetected disease. We review recent research on changes of the cerebral cortex and the hippocampus in aging and the borders between normal aging and AD. We argue that prominent cortical reductions are evident in fronto-temporal regions in elderly even with low probability of AD, including regions overlapping the default mode network. Importantly, these regions show high levels of amyloid deposition in AD, and are both structurally and functionally vulnerable early in the disease. This normalcy-pathology homology is critical to understand, since aging itself is the major risk factor for sporadic AD. Thus, rather than necessarily reflecting early signs of disease, these changes may be part of normal aging, and may inform on why the aging brain is so much more susceptible to AD than is the younger brain. We suggest that regions characterized by a high degree of life-long plasticity are vulnerable to detrimental effects of normal aging, and that this age-vulnerability renders them more susceptible to additional, pathological AD-related changes. We conclude that it will be difficult to understand AD without understanding why it preferably affects older brains, and that we need a model that accounts for age-related changes in AD-vulnerable regions independently of AD-pathology.

Keywords: Alzheimer's disease (AD); Amyloid; Cerebral cortex; Default mode network (DMN); Hippocampus; Normal aging.


Figures

Figure 1
Figure 1. Longitudinal episodic memory decline in aging
Left panel: By using a random-effects pattern-mixture model, Josefsson and colleagues (2012), found individual differences both in initial memory scores (offset at time 0) and change over time in their large sample (n > 1500) of initially healthy participants, with some maintaining their functional level (18%), some showing age-average decline (68%), while some declined (13%). The researchers were able to identify environmental and genetic factors predicting group membership. Right panel: Correcting for selective attrition reveal a much steeper decline in episodic memory with increasing age than analyzing the full sample of available data. Figures modified from Josefsson et al. (2012).
Figure 2
Figure 2. Longitudinal cortical volumetric reductions in aging
Upper panel shows annual percent volume reduction of the cerebral cortex in a longitudinal sample of 132 healthy elderly (55–91 years at baseline) from ADNI (Alzheimer’s Disease Neuroimaging Initiative). Lower panel shows the same data, but the values have been re-scaled to yield a mean of zero and a standard deviation of one, to allow better visualization of regional distribution of change. Blue-cyan colors represent areas that are reduced more in one year than the rest of the cortex, while red-yellow colors represent areas of less than average reduction. The often-observed fronto-temporal pattern of relative increased atrophy is evident, with medial parietal cortex/posterior cingulate as additional regions with high rates of atrophy in aging. Data from (Fjell et al., 2013a).
Figure 3
Figure 3. Age-thickness correlations
Correlations between age and cortical thickness in a healthy multi-site adult life-span sample (n = 1100, age 18–94). Correlations exceed −.40 in large regions, approaching −.70 in the prefrontal and lateral temporal cortex. Data from (Fjell et al., 2012).
Figure 4
Figure 4. Accelerated entorhinal decline in aging
Cross-sectional estimates of annual rate of cortical thinning in the entorhinal cortex across the adult life indicate a marked increase in atrophy from 50 years. Age-related acceleration of decline in elderly has been confirmed with longitudinal data. Data from (Fjell et al., 2012).
Figure 5
Figure 5. Life-span trajectories of volumetric reductions
Cross-sectional estimates of adult life-span trajectories of total cerebral cortex volume and total hippocampal volume. Volume is expressed in units of standard deviations. Data from (Fjell et al., 2013c).
Figure 6
Figure 6. Cross-sectional vs. longitudinal results
Left panel shows percentage annual change in cortical thickness measured longitudinally in a sample of healthy elderly (n = 207, 60–93 years). The right panel shows percentage annual change in cortical thickness estimated cross-sectionally in the same sample of participants. As can be seen, the apparent thickening of the anterior cingulate cortex in the cross-sectional analyses is not confirmed by the longitudinal results, indicating that this likely arises from issues with selective sampling. Also, estimated change is smaller in the cross-sectional compared to the longitudinal results. In other respects, the results are more similar. Data from (Fjell et al., 2012).
Figure 7
Figure 7. Different effects of age on cortical surface area, thickness and gyrification
Different structural features of the cerebral cortex have different genetic architecture and are reflecting different neurobiological events. Cortical surface area, thickness and gyrification are all negatively related to age, but to a different degree and with somewhat different regional distribution of effects. The results are displayed on the white matter surface of the brain. Gyrification index is defined as the ratio between the buried cortex and the visible, outer surface cortex. Data from (Hogstrom et al., 2012).
Figure 8
Figure 8. Fronto-striatal vs. temporo-parietal networks
While normal aging affects both a fronto-striatal network important for cognitive control and executive function (green structures), AD has additional effects on a temporo-parietal network important for episodic memory function (purple structures).
Figure 9
Figure 9. Evolutionary expansion and volume decline in aging
Upper panel shows regions of high vs. lower cortical expansion from macaque monkeys to humans (maps re-computed from (Hill et al., 2010)). Lower panel shows regions of high vs. lower volumetric reduction in aging (based on the data from Figure 2). There is overlap between evolutionary high-expanding regions in temporal and frontal cortex and regions with high decline in aging. The right panel shows annual volumetric decline in regions of high (z ≥ 0.5 SD), medium (−0.5 < z < 0.5) and low (z ≤ −0.5) evolutionary expansion. As can be seen, annual decline in aging is related to degree of expansion during evolution (for all comparisons, p < .05, corrected).
Figure 10
Figure 10. Aging of the default mode network
Annual percentage change in brain volume for six selected areas of the default mode network (DMN) in 132 healthy elderly (based on data from Figure 2). Both the medial and the lateral DMN changed significantly more than the whole brain rate of 0.44% (mean atrophy in the medial DMN: 0.70%, t [131] = 4.75, p < 10−5; mean atrophy in the lateral DMN: 0.53%, t [131] = 2.10, p < .05). Compared to the average cortical change (not including hippocampus) of 0.39%, the age-vulnerability of DMN is even larger.
Figure 11
Figure 11. Differences in cortical atrophy rates between healthy elderly and Mild Cognitive Impairment/Alzheimer’s Disease
In mild cognitive impairment (MCI), rates of cortical volumetric reductions are more than double that seen in healthy aging across large areas of the cerebral cortex, and rates more than three times larger are seen in AD. Please note that the scale is different between MCI/healthy and AD/healthy to allow appreciation of the regional patterns of effects across groups. Data from the Alzheimer’s Disease Neuroimaging Initiative.
Figure 12
Figure 12. Comparison of aging and Mild Cognitive Impairment/Alzheimer’s Disease
Comparison of the standardized pattern of atrophy in a group of APOE ε4 negative elderly with normal levels of CSF Aβ, mild cognitive impairment (MCI) and AD. Atrophy maps are standardized within each group by Z-transformation, yielding maps showing areas of more (blue-cyan) vs. less (red-yellow) atrophy for each group in terms of standard deviations. Thus, atrophy is scaled within group, and changes are relative to group means. Across groups, we see common patterns of standardized change in the lateral and medial temporal lobe (including the hippocampus, not shown), and a distinct pattern characterizing only healthy elderly in the prefrontal cortex, especially the orbitofrontal part. Figure from (Fjell et al., 2013a). Atrophy across the cortex in the healthy elderly and the AD patients correlated .81, showing substantial overlap in regional vulnerability.
Figure 13
Figure 13. Dendritic spine morphology in aging
Benavides-Piccione et al (2013) 3D reconstructed 8900 individual dendritic spines from layer III pyramidal neurons in the cingulate cortex from two male humans of age 40 and 85 years, using intracellular injections of Lucifer Yellow in fixed tissue. The left two panels show the 3D reconstruction of the complete morphology of each spine of an apical dendritic segment at 100 μm distance from the soma, and the estimation of the spine volumes shown in color codes (0–1.345 μm3). The middle two panels show mean dendritic diameter and dendritic spine density in apical dendrites in the middle-aged and the older participant. The right two panels show examples of apical dendritic segments from the middle-aged and the older participants. The differences in spine morphology are easily seen. Figure modified with permission from (Benavides-Piccione et al., 2013).
Figure 14
Figure 14. CSF biomarkers and regional atrophy in aging and MCI
Upper panel: CSF biomarkers of Aβ and p-Tau, indexing brain levels of amyloid and tangle load, respectively, correlate with temporal atrophy in stable MCI patients from ADNI (n = 213). In contrast, the correlations between atrophy and Aβ in amyloid positive healthy elderly (Aβ1-42 < 175 pg/ml (Fjell et al., 2010a)) are seen in other cortical areas exclusively. This may indicate that the relationship between atrophy and amyloid is different in healthy aging and MCI, and that the selective lack of relationship between amyloid beta and atrophy in the medial temporal lobe in controls may represent a key to understand why these participants have not progressed to AD. Lower panel: Histopathological maps from Braak and Braak, projected onto the same template brain. The topographical pattern of accumulated amyloid in AD brains resembles the Aβ-atrophy correlations seen in MCI to a much larger extent than the Aβ-atrophy correlations seen in non-demented elderly.
Figure 15
Figure 15. Selected studies on amyloid and cortical structure in non-demented older adults
Representative studies of the relationship between amyloid levels (PiB PET or CSF Aβ) and cortical thickness (baseline) or cortical atrophy (longitudinal) in healthy elderly (Storandt et al., 2009, Fjell et al., 2010a, Tosun et al., 2010a, Becker et al., 2011, Arenaza-Urquijo et al., 2013b). Common for these studies was the use of anatomically unbiased surface-based cortical analyses using FreeSurfer (surfer.nmr.mgh.hardard.edu). We extracted the effect sites from the published figures, and projected them onto the same standard brain to allow visual comparison of the results. For some, the colors of the effects were changed to aid discriminability between the different studies. The main conclusions are that Aβ levels are not related to cortical thickness/atrophy on cognitively healthy elderly in typical AD areas in the medial temporal lobe (green box).
Figure 16
Figure 16. A speculative model of Aβ-atrophy relationships in normal aging and MCI
One speculative explanation for the discrepant Aβ-atrophy relationships in healthy aging vs. MCI (see Figure 12) would be to assume that lesions related to amyloid levels can occur in several places in the cortex in aging. Lesions targeting the temporal lobe will tend to yield memory problems that are difficult to compensate for, increasing the likelihood of an MCI diagnosis. In contrast, lesions in other parts of the cortex are less directly related to memory problems and may also be easier to compensate for, thus reducing the likelihood of an MCI/AD diagnosis. This would cause the observed discrepancy in regional distribution of amyloid-atrophy relationships between clinically normal older adults and MCI patients.

References

    1. Addis DR, Roberts RP, Schacter DL. Age-related neural changes in autobiographical remembering and imagining. Neuropsychologia. 2011;49:3656–3669. - PMC - PubMed
    1. Aimone JB, Deng W, Gage FH. Adult neurogenesis: integrating theories and separating functions. Trends Cogn Sci. 2010;14:325–337. - PMC - PubMed
    1. Andreasen NC, O’Leary DS, Cizadlo T, Arndt S, Rezai K, Watkins GL, Ponto LL, Hichwa RD. Remembering the past: two facets of episodic memory explored with positron emission tomography. Am J Psychiatry. 1995;152:1576–1585. - PubMed
    1. Andrews-Hanna JR, Reidler JS, Sepulcre J, Poulin R, Buckner RL. Functional-anatomic fractionation of the brain’s default network. Neuron. 2010;65:550–562. - PMC - PubMed
    1. Andrews-Hanna JR, Snyder AZ, Vincent JL, Lustig C, Head D, Raichle ME, Buckner RL. Disruption of large-scale brain systems in advanced aging. Neuron. 2007;56:924–935. - PMC - PubMed

Publication types