. 2014 Oct;22(10):1190-200.
doi: 10.1038/ejhg.2014.1. Epub 2014 Feb 19.

Using ancestry-informative markers to identify fine structure across 15 populations of European origin

Collaborators, Affiliations

Using ancestry-informative markers to identify fine structure across 15 populations of European origin

Laura M Huckins et al. Eur J Hum Genet. 2014 Oct.

Abstract

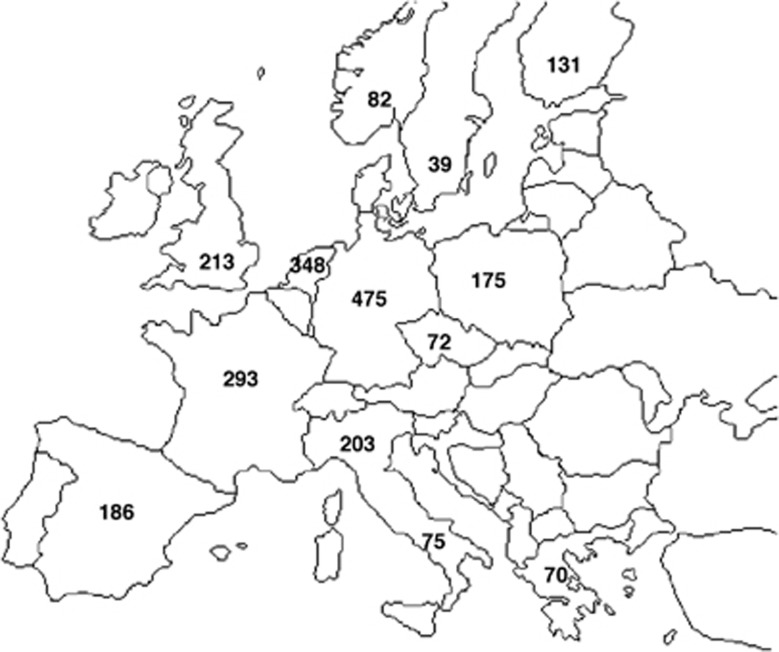
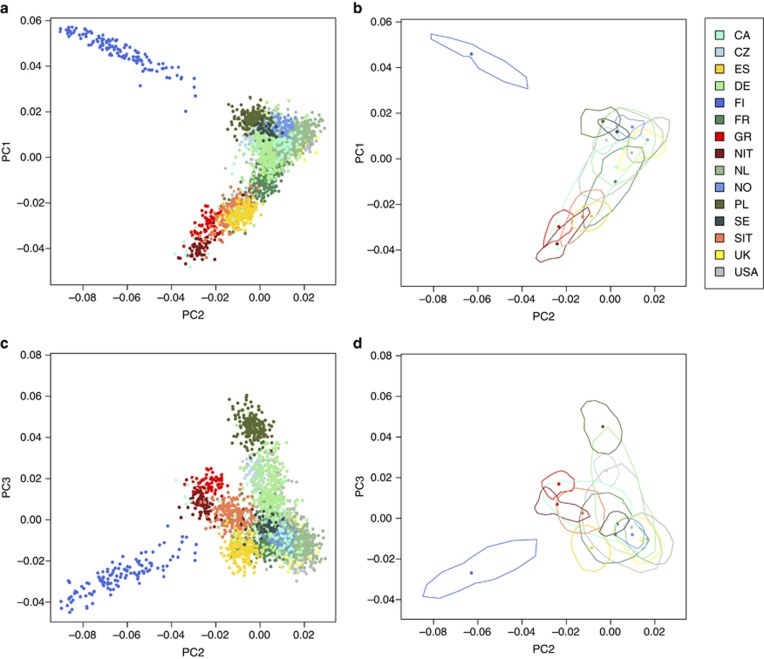
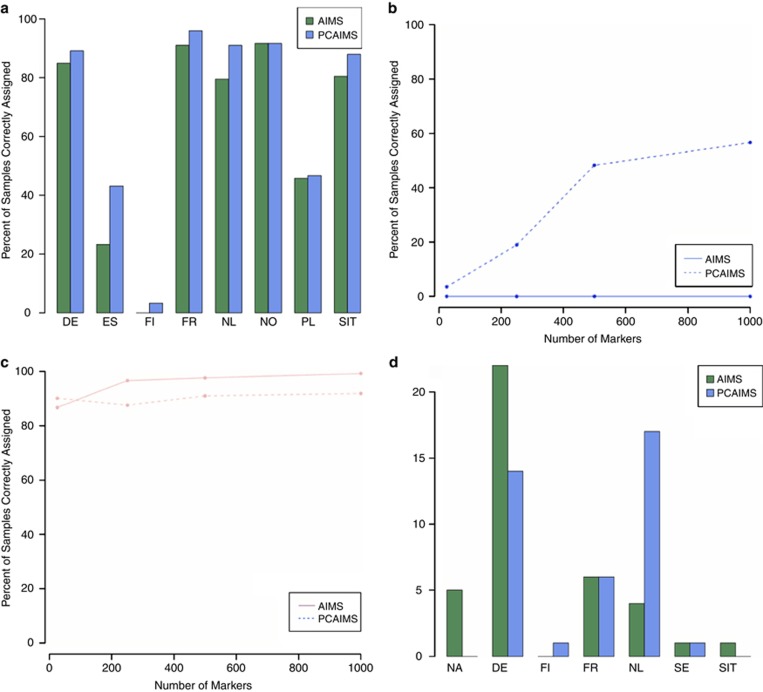
The Wellcome Trust Case Control Consortium 3 anorexia nervosa genome-wide association scan includes 2907 cases from 15 different populations of European origin genotyped on the Illumina 670K chip. We compared methods for identifying population stratification, and suggest list of markers that may help to counter this problem. It is usual to identify population structure in such studies using only common variants with minor allele frequency (MAF) >5%; we find that this may result in highly informative SNPs being discarded, and suggest that instead all SNPs with MAF >1% may be used. We established informative axes of variation identified via principal component analysis and highlight important features of the genetic structure of diverse European-descent populations, some studied for the first time at this scale. Finally, we investigated the substructure within each of these 15 populations and identified SNPs that help capture hidden stratification. This work can provide information regarding the designing and interpretation of association results in the International Consortia.


Figures

Figure 1
Figure 1
Geographical distribution of samples across Europe.
Figure 2
Figure 2
Fine structure between the 15 European populations studied. (a) Fine structure across all populations: PC1 versus PC2. (b) The distribution of samples is shown for each population. Outlying samples (deviating in location by more than 3 SDs from the mean) were excluded. A three-point moving average filter was used to smooth outlines. (c) Fine structure across all populations: PC2 versus PC3. (d) The distribution of samples is shown for each population, calculated as in (b). CA, Canada; CZ, Czech Republic; DE, Germany; ES, Spain; FI, Finland; FR, France; GR, Greece; NIT, North Italy; NL, Netherlands; NO, Norway; PL, Poland; SE, Sweden; SIT, South Italy; UK, United Kingdom; USA, United States of America
Figure 3
Figure 3
Genetic distance correlates with geographical distance. We computed pair-wise Fst between all populations, and compared this to the geographic distance in kilometres between the midpoints of each population. R2=0.465.
Figure 4
Figure 4
AIMs and PCAIMs are able to predict sample ancestry with high accuracy for most populations, even at small numbers of markers. (a) Percent of samples correctly assigned using 25 markers, across all populations. AIMs are shown in green, PCAIMs in blue. (b) Assignment of Finnish samples, for varying numbers of markers. AIMs are shown as a solid line and PCAIMs as a dashed line. (c) Assignment of German samples, with increasing numbers of markers. (d) Assignment of Swedish samples, using 25 markers; AIMs are shown in green and PCAIMs in blue.

References

    1. Marchini J, Cardon LR, Phillips MS, Donnelly P. The effects of human population structure on large genetic association studies. Nat Genet. 2004;36:512–517. - PubMed
    1. Devlin B, Roeder K. Genomic control for association studies. Biometrics. 1999;55:997–1004. - PubMed
    1. Menozzi P, Piazza A, Cavalli-Sforza L. Synthetic maps of human gene frequencies in Europeans. Science. 1978;201:786–792. - PubMed
    1. Novembre J, Johnson T, Bryc K, et al. Genes mirror geography within Europe. Nature. 2008;456:98–103. - PMC - PubMed
    1. Lao O, van Duijn K, Kersbergen P, de Knijff P, Kayser M. Proportioning whole-genome single-nucleotide polymorphism diversity for the identification of geographic population structure and genetic ancestry. Am J Hum Genet. 2006;78:680–690. - PMC - PubMed

Publication types

Substances