. 2014 Jun 15:56:359-67.
doi: 10.1016/j.bios.2014.01.018. Epub 2014 Jan 18.

Surface plasmon resonance fiber sensor for real-time and label-free monitoring of cellular behavior

Affiliations

Surface plasmon resonance fiber sensor for real-time and label-free monitoring of cellular behavior

Yanina Shevchenko et al. Biosens Bioelectron. .

Abstract

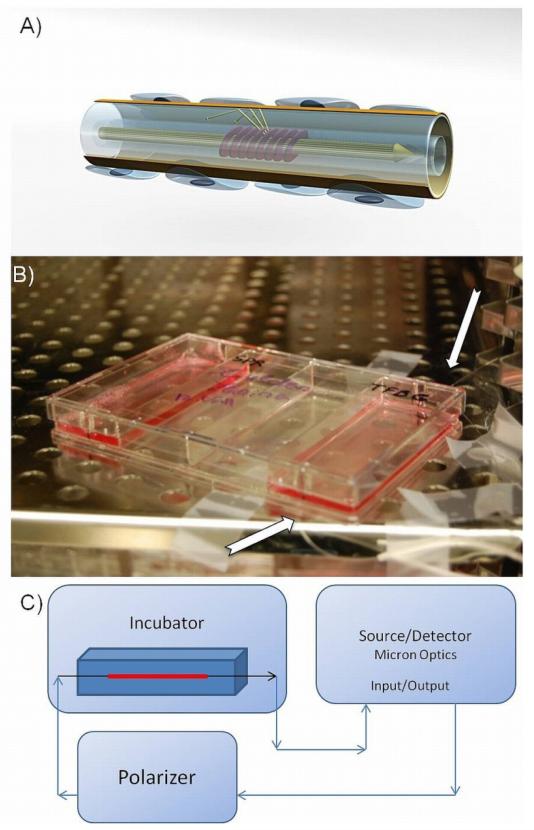
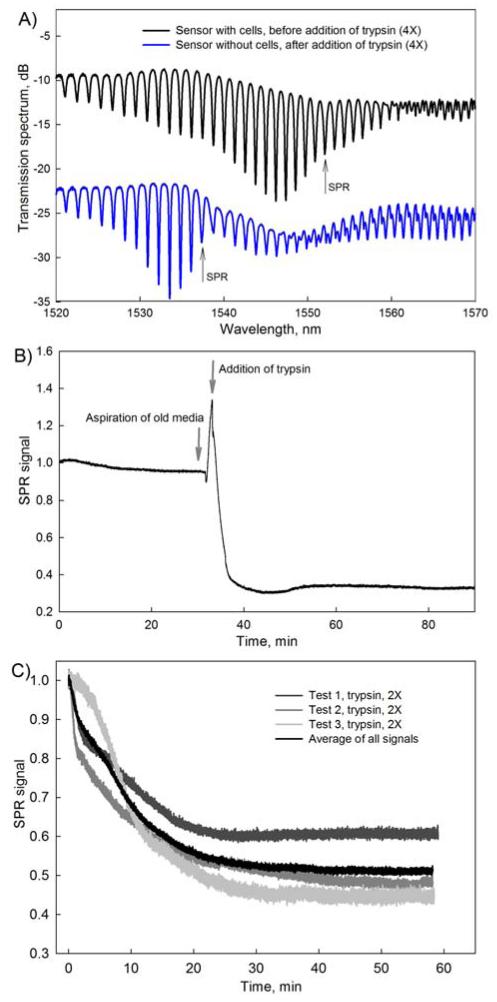
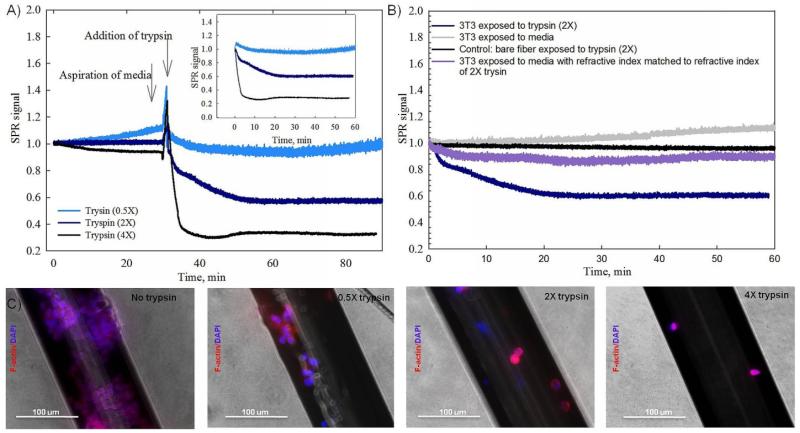
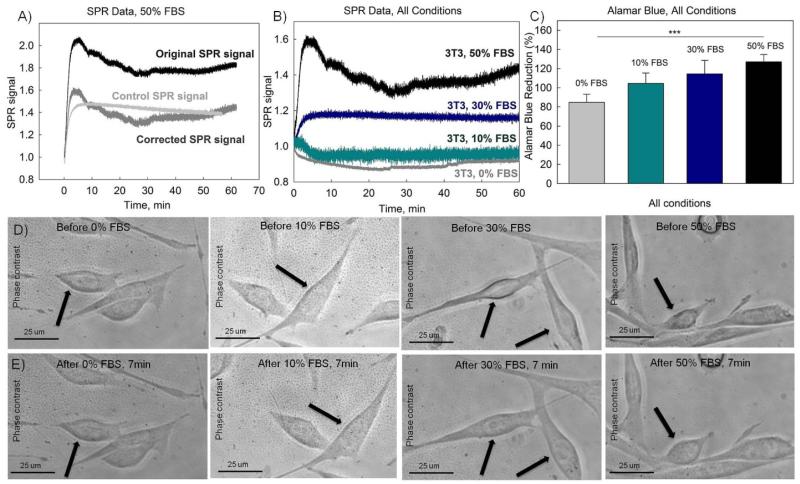
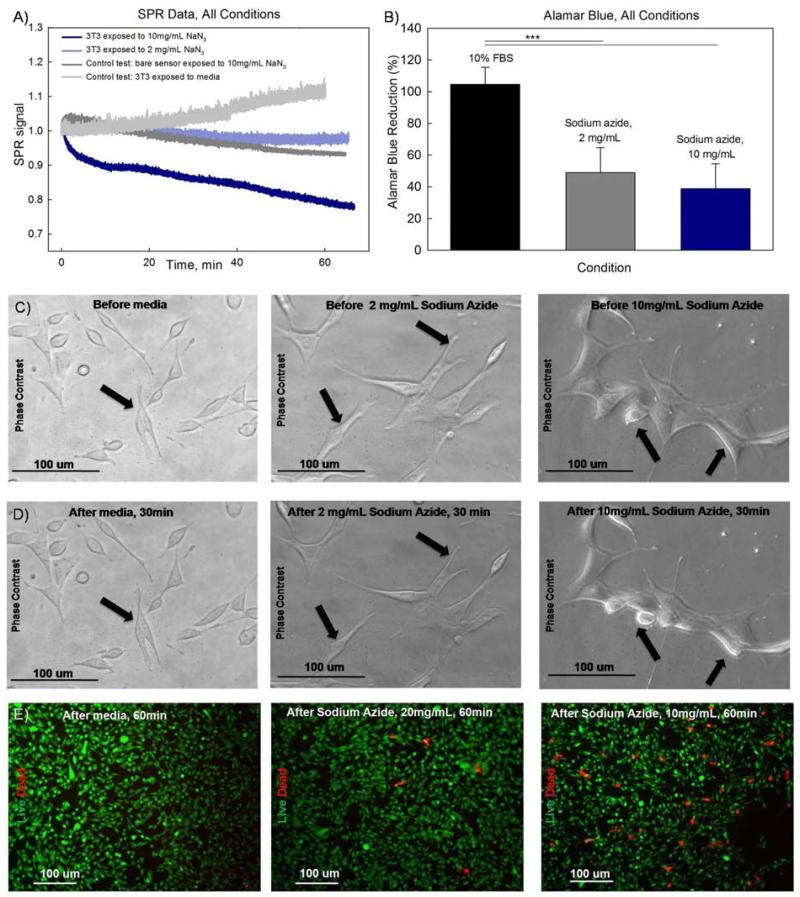
This paper reports on the application of an optical fiber biosensor for real-time analysis of cellular behavior. Our findings illustrate that a fiber sensor fabricated from a traditional telecommunication fiber can be integrated into conventional cell culture equipment and used for real-time and label-free monitoring of cellular responses to chemical stimuli. The sensing mechanism used for the measurement of cellular responses is based on the excitation of surface plasmon resonance (SPR) on the surface of the optical fiber. In this proof of concept study, the sensor was utilized to investigate the influence of a number of different stimuli on cells-we tested the effects of trypsin, serum and sodium azide. These stimuli induced detachment of cells from the sensor surface, uptake of serum and inhibition of cellular metabolism, accordingly. The effects of different stimuli were confirmed with alamar blue assay, phase contrast and fluorescence microscopy. The results indicated that the fiber biosensor can be successfully utilized for real-time and label-free monitoring of cellular response in the first 30 min following the introduction of a stimulus. Furthermore, we demonstrated that the optical fiber biosensors can be easily regenerated for repeated use, proving this platform as a versatile and cost-effective sensing tool.

Keywords: Cellular analysis; Cellular response; Plasmonic fiber sensor; Real-time and label-free sensing.


Figures

Fig. 1
Fig. 1
Optical fiber configuration. (A) 3D illustration of a fiber sensor with cells attached to the surface of the gold coating. Fringes in the core of the fiber indicate the tilted grating that redirects the light towards the surface of the fiber; (B) Photograph of a 4-well plate with an integrated fiber sensor during a typical experiment. Arrows point at an optical fiber wired outside the plate; (C) Schematic of the optical interrogation setup (all the line arrows represent single mode fiber connections).
Fig. 2
Fig. 2
Typical SPR curves obtained with the fiber sensor. (A) SPR-TFBG transmission spectra. The black spectrum is obtained for a sensor with NIH-3T3 cells on its surface. The blue spectrum is from the same sensor after the cells were detached using trypsin (4×). Quantitative information is extracted by measuring the amplitude change of the most sensitive resonance indicated by an arrow; (B) Change in the amplitude of the most sensitive SPR resonance following the addition of trypsin (4×); (C) Reproducibility of experiments with trypsin at 2× concentration. The black curve is the average of the all SPR signals with a confidence interval of σ=0.578.
Fig. 3
Fig. 3
Real-time SPR signals obtained during cellular exposure to trypsin solutions, control SPR measurements, and cytoskeleton/nuclei imaging. (A) The SPR response was measured while NIH-3T3 cells were exposed to trypsin solutions (0.5×, 2× and 4× concentrations). Arrows indicate points at which the old medium was aspirated and the new solution was added. Inset shows SPR responses starting from the moment of addition of stimuli. (B) Various control experiments were performed to monitor SPR responses in the presence and absence of trypsin (2×). (C) Cytoskeleton/nucleus staining (F-actin/DAPI) demonstrates the remaining cells on the sensor surface after exposure to different concentrations of trypsin.
Fig. 4
Fig. 4
The addition of serum and its uptake by cells monitored in real-time with SPR fiber sensors confirmed with alamar blue assay and phase contrast imaging. (A) SPR responses during exposure to 50% (v/v) FBS solution. The black curve is the original SPR signal obtained in the presence of cells, the grey curve is a control SPR signal obtained in the absence of cells. The dark grey curve is the corrected SPR signal found as a difference between the original SPR and the control SPR signals. (B) Corrected SPR responses during exposure to different serum solutions (10%, 30% and 50% (v/v)) versus response to medium without FBS. (C) Alamar blue assay results for cells exposed to different concentrations of FBS; (D-E) Phase contrast images of the NIH-3T3 cells exposed to FBS solutions (50% FBS, 30% FBS, 10%FBS and 0%FBS). (D) Images were taken before the addition of FBS. (E) Images were taken 7 minutes after the addition of FBS.
Fig. 5
Fig. 5
Real-time SPR response during cellular exposure to sodium azide complemented with alamar blue assay results and imaging confirming the effect of the toxin on cellular mortphology and viability. (A) SPR responses during cellular exposure to sodium azide (10 mg/ml, 2 mg/ml) and medium versus SPR control response to sodium azide (10mg/ml) in the absence of cells. (B) Alamar blue assay results for the applied concentrations of sodium azide. (C-D) Phase contrast images of NIH-3T3 cells exposed to sodium azide (10mg/ml and 2mg/ml) and standard medium. (C) Images of cells right before addition of sodium azide. (D) Images of the same cells 30 minutes after addition of sodium azide. (E) Live/dead staining of NIH-3T3 cells exposed to sodium azide (10mg/ml, 2mg/ml) and standard medium for one hour.

References

    1. Albert J, Lepinay S, Caucheteur C, DeRosa MC. Methods. 2013 accepted. - PubMed
    1. Amin R, Kulkarni A, Kim T, Park SH. Current Applied Physics. 2012;12(3):841–845.
    1. Bhatta D, Stadden E, Hashem E, Sparrow IJG, Emmerson GD. Sensors and Actuators B-Chemical. 2010;149(1):233–238.
    1. Caucheteur C, Shevchenko Y, Shao LY, Wuilpart M, Albert J. Optics Express. 2011;19(2):1656–1664. - PubMed
    1. Caucheteur C, Voisin V, Albert J. Optics Express. 2013;21(3):3055–3066. - PubMed

Publication types

LinkOut - more resources