. 2014 Sep;7(5):1209-20.
doi: 10.1038/mi.2014.10. Epub 2014 Feb 19.

Targeting sirtuin-1 alleviates experimental autoimmune colitis by induction of Foxp3+ T-regulatory cells

Affiliations

Targeting sirtuin-1 alleviates experimental autoimmune colitis by induction of Foxp3+ T-regulatory cells

T Akimova et al. Mucosal Immunol. 2014 Sep.

Abstract

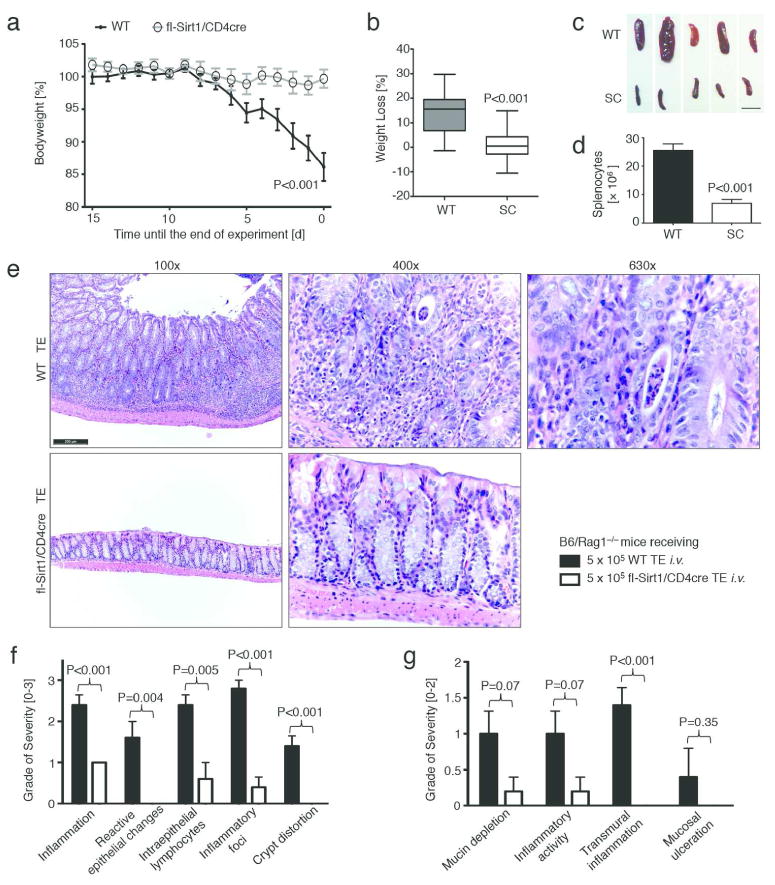
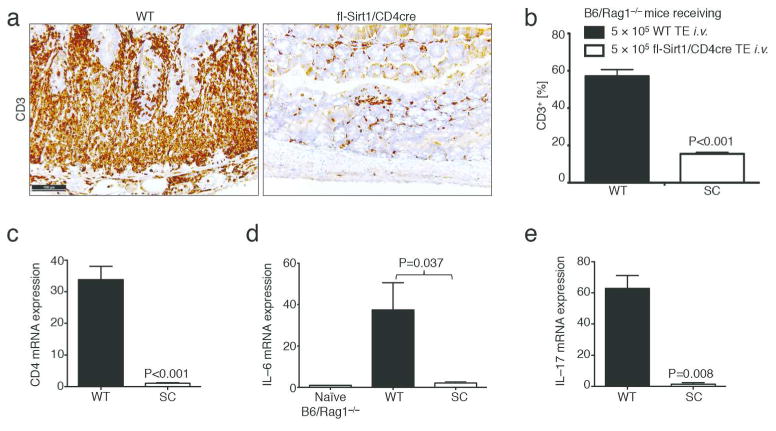
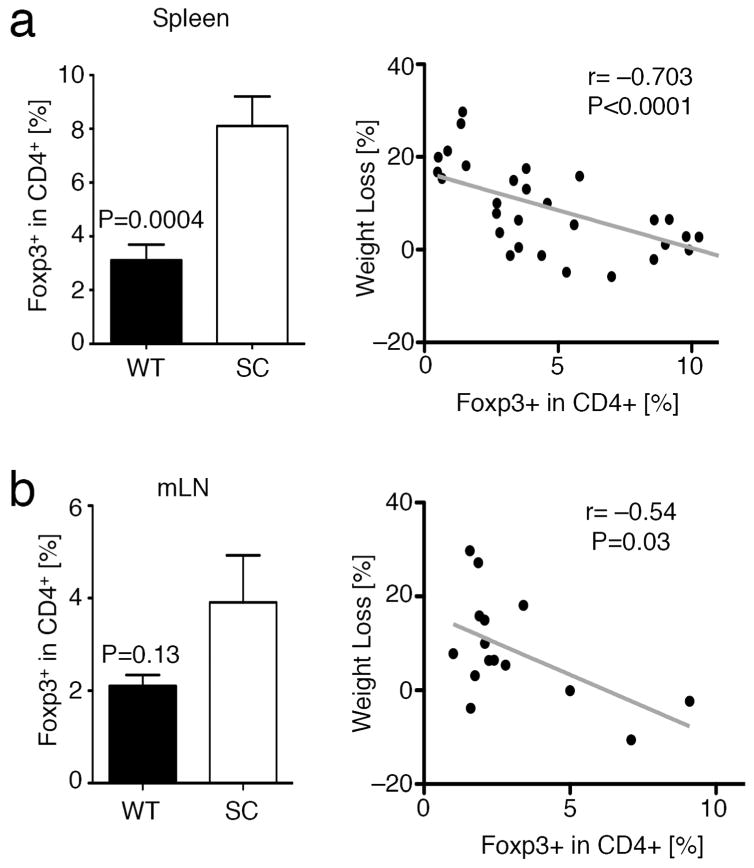
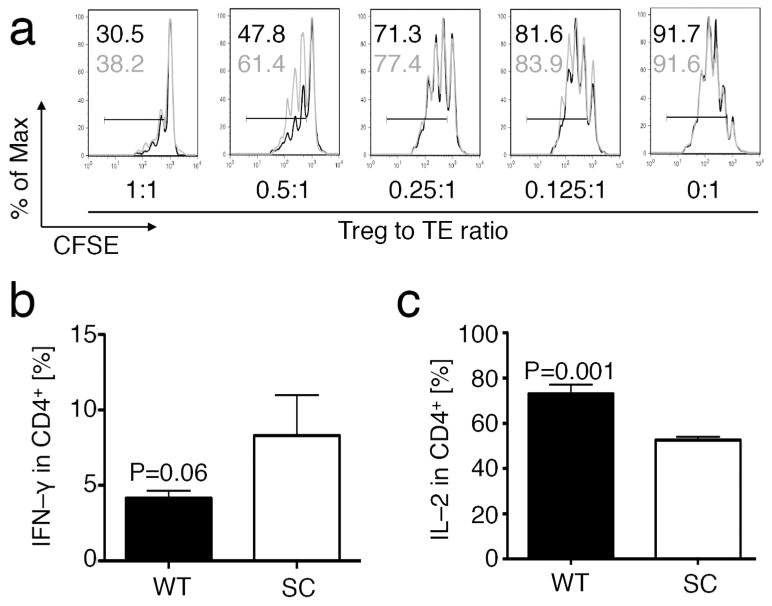
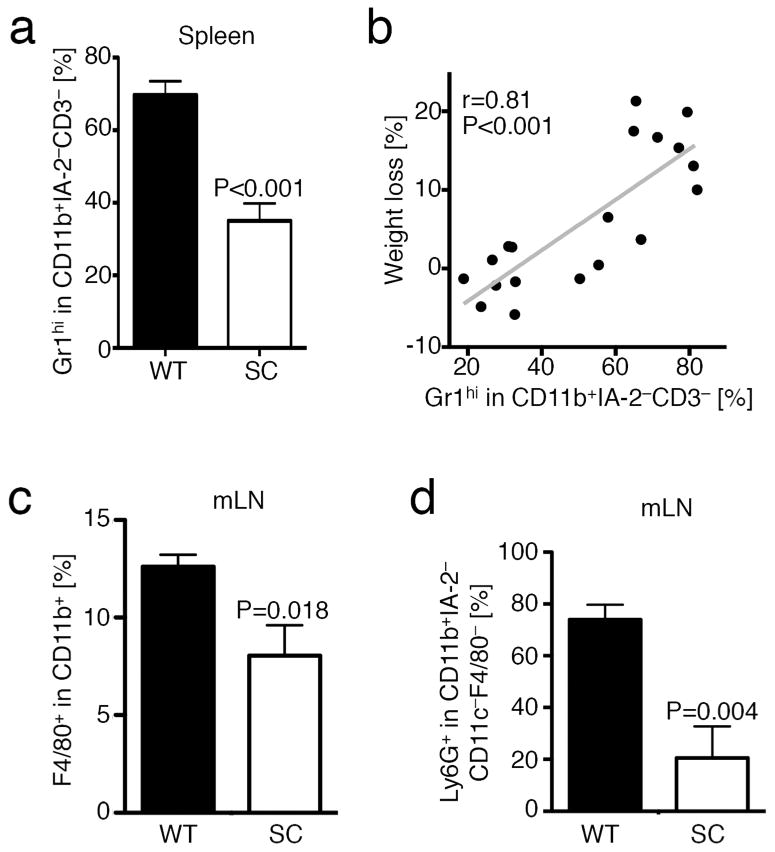
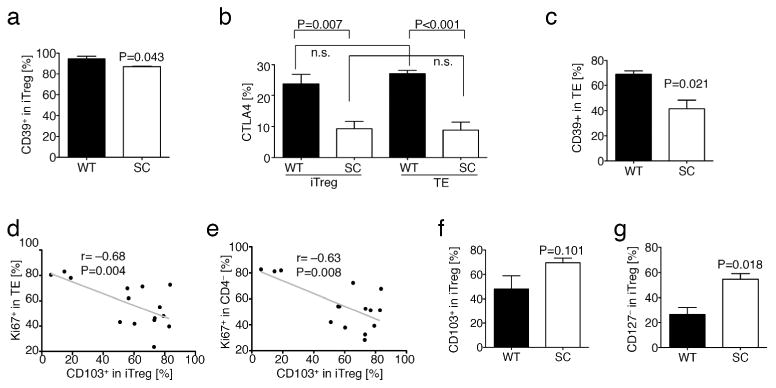
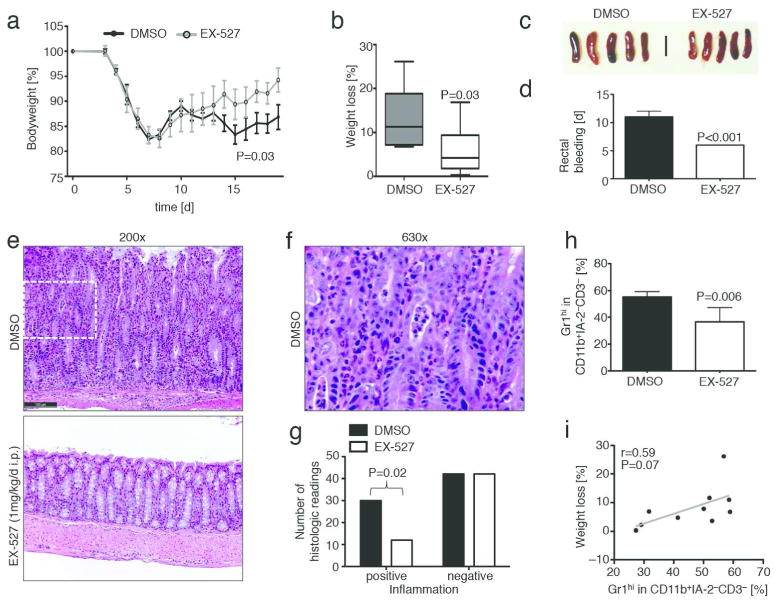
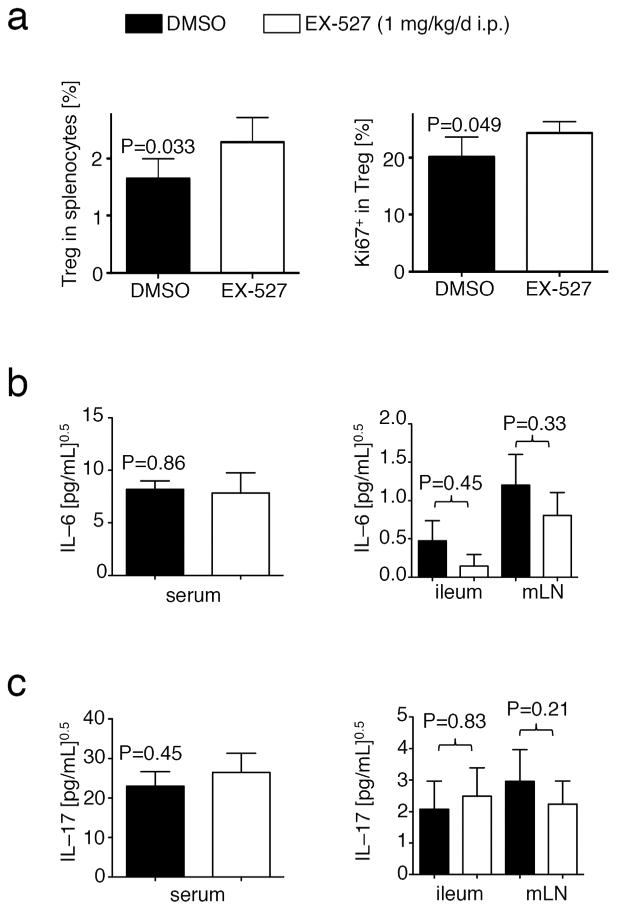
Induced Forkhead box P3-positive (Foxp3(+)) T-regulatory cells (iTregs) are essential to gastrointestinal immune homeostasis, and loss of the ability to develop iTregs may lead to autoimmune colitis. We previously showed a role for sirtuin-1 (Sirt1) in control of Treg function and hypothesized that targeting of Sirt1 might enhance iTreg development and thereby represent a potential therapy for inflammatory bowel disease (IBD). We adoptively transferred CD4(+)CD25(-)Foxp3(-) T effector (TE) cells from wild-type (WT) (C57BL/6) or fl-Sirt1/CD4cre mice into B6/Rag1(-/-) mice and monitored the mice until they lost 10-15% of their weight. Adoptive transfer of TE cells lacking Sirt1 to B6/Rag1(-/-) mice resulted in a 2.8-fold increase in iTreg formation compared with mice receiving WT TE cells and correlated with attenuated colitis and reduced weight loss (1.04±1.4% vs. 13.97±2.2%, respectively, P<0.001). In a second model of IBD, we used pharmacologic Sirt1 targeting of mice receiving multiple cycles of dextran sodium sulfate (DSS) in their drinking water, alternated with fresh water. Likewise, WT mice receiving cyclic DSS and a Sirt1 inhibitor, EX-527, had reduced weight loss (5.8±5.9% vs. 13.2±6.9%, respectively, P=0.03) and increased iTreg formation compared with controls. Sirt1 appears a promising target for pharmacologic therapy of IBD as a result of promoting iTreg development.


Conflict of interest statement

The authors declare no conflicts of interest.

Figures

Figure 1
Figure 1
T effector cells lacking Sirt1 cause less autoimmune colitis. Twelve weeks old B6/Rag1−/− mice were adoptively transferred with 5 × 10⁵ CD4+CD25 (<1.1% Foxp3+) T effector cells (TE) i.v. of either C57Bl/6 wild type (WT) or fl-Sirt1/CD4cre (SC) origin and followed until autoimmune colitis developed. Data pooled from four independent experimental setups (n=34 mice). (a, b) B6/Rag1−/− mice injected with SC TE developed less disease and weight loss. (a) Weight curves, normalized to the end point of each of the three independent experiments. (b) Percent weight loss as boxplots (whiskers: 5th-95th percentile). (c) Smaller spleen size in fl-Sirt1/CD4cre TE injected B6/Rag1−/− mice. Scale bar indicates 1 cm. (d) B6/Rag1−/− mice receiving WT TE showed a higher spleenocyte count than fl-Sirt1/CD4cre TE recipients. (e) Colonic specimens from B6/Rag1−/− mice receiving WT TE show significant colitis including marked crypt architectural distortion (100x original magnification) with neutrophilic infiltration of the lamina propria, crypt epithelium (“cryptitis”) and glandular lumina (“crypt abscess”, see 630x original magnification). In contrast, adoptive transfer of TE lacking Sirt1 produced much less signs of colitis. H&E staining; scale bar indicates 200 μm. (f, g) Pooled data from blinded histologic analysis demonstrate less colitis pathology in mice adoptively transferred with fl-Sirt1/CD4cre TE (n=10).
Figure 2
Figure 2
Lack of Sirt1 in T cells leads to decreased T cell infiltration into the colonic mucosa. (a, b) Immunohistochemistry of CD3 showing decreased T cell infiltration in Rag1−/− mice adoptively transferred with fl-Sirt1/CD4cre (SC) versus WT T effector cells, respectively (experimental conditions as in Figure 1). (b) Pooled histologic data from automated slide quantification (n=10). (c–e) mRNA expression profiles from colonic tissue indicates increased CD4, IL–6 and IL–17 mRNA expression in B6/Rag1−/− recipients of WT compared to SC TE (n=8).
Figure 3
Figure 3
T effector cells lacking Sirt1 are more susceptible to Foxp3+Treg induction in vivo. Pooled analysis of flow cytometry data of experiments from Figure 1. (a) Splenocytes from B6/Rag1−/− mice adoptively transferred with fl-Sirt1/CD4cre (SC) TE exhibited an increased fraction of induced Treg (left panel). Weight loss negatively correlated with iTreg conversion (right panel). (b) Similarly, mesenteric lymph nodes (mLN) from B6/Rag1−/− mice receiving SC TE tended to have increased Foxp3+ iTreg (left panel), which is negatively correlated with weight loss (right panel).
Figure 4
Figure 4
Sirt1 and T effector function. (a) Comparison of CFSE labeled WT (black) or fl-Sirt1/CD4cre (grey) TE (CD4+CD25) to be suppressed by WT Tregs in vitro, showing near equal susceptibility. TE proliferation indicated by percentage for both WT (black) and fl-Sirt1/CD4cre (grey). Percent of maximum (% of Max) shows normalization of overlaid data and represents number of cells in each bin divided by the number of cells in the bin that contains the largest number of cells. (b, c) WT and fl-Sirt1/CD4cre (SC) TE were stimulated with PMA/ionomycin to elicit cytokine production, showing a trend towards higher IFN–γ (b), and decreased IL–2 production (c). Data are representative of three independent experiments.
Figure 5
Figure 5
T effector and host cells are less proliferative in B6/Rag1−/− recipients of fl-Sirt1/CD4cre TE. Pooled analysis of flow cytometry data of experiments from Figure 1. (a, b) Among adoptively transferred (a) TE that remained Foxp3 negative, as well as host (b) CD4 cells, Ki–67 expression was reduced in B6/Rag1−/− mice receiving SC TE. (c, d) Ki–67 in Foxp3TE (c) and host cells (d) positively correlated with weight loss.
Figure 6
Figure 6
Lack of Sirt1 in T cells limits recruitment of granulocytes and macrophages. Pooled analysis of flow cytometry data of experiments from Figure 1. (a) Flow cytometry showing decreased CD11b+Gr1hi granulocytes in B6/Rag1−/− mice adoptively transferred with fl-Sirt1/CD4cre (SC) compared WT T effector cells (n=19). (b) Presence of these cells positively correlated with weight loss (n=19). (c) F4/80+ macrophages and (d) Ly6G+ granulocytes were decreased in mesenteric lymph nodes of B6/Rag1−/− mice adoptively transferred with fl-Sirt1/CD4cre compared WT T effector cells (n=10).
Figure 7
Figure 7
Induced Foxp3+Treg lacking Sirt1 are characterized by reduced CD127 expression and better suppression of TE and host cells. Pooled analysis of flow cytometry data of experiments from Figure 1. (a) iTreg (CD4+Foxp3+) from WT and fl-Sirt1/CD4cre (SC) express near similar levels of CD39. (b) CTLA4 expression is lower in SC TE (CD4+Foxp3) as well as iTreg, but overall related to cell activation and proliferation rather than being a Treg selective marker. (c) CD39 expression is decreased in SC TE. (d, e) Ki-67 expression in Foxp3 TE (d) and CD4 host cells (e) negatively correlated with CD103+ expression in iTreg. (f) CD103 expression on iTreg shows a trend towards higher expression in B6/Rag1−/− mice injected with fl-Sirt1/CD4cre TE. (g) CD127 iTreg are more prevalent in fl-Sirt1/CD4cre TE adoptively transferred B6/Rag1−/− mice.
Figure 8
Figure 8
Rescue with thymic fl-Sirt1/Foxp3cre Treg is not superior to Foxp3cre Treg control. B6/Rag1−/− mice injected i.v. with 5 × 10⁵ 99% pure CD4+Foxp3 WT TE developed colitis with weight loss after 5 days. Mice with 5-15% weight loss were adoptively transferred i.v. with 3 × 10⁵ YFP-sorted Treg freshly isolated from spleens of either fl-Sirt1/Foxp3cre or Foxp3cre control mice. Data pooled from two independent experiments with 4 mice/group. (a) CD4+YFP+ Treg are higher in fl-Sirt1/Foxp3cre than Foxp3cre control Treg treated mice, suggestive of better Foxp3+ preservation. (b) Injection of thymic Treg led to a transient improvement in weight with either treatment. (c) Colon specimens indicate equal length (pooled data). (d) CD4+ TE reconstituted from B6/Rag1−/− mice react with equal cytokine production to PMA/ionomycin stimulation.
Figure 9
Figure 9
Sirt1 inhibition limits severity of DSS induced colitis and leads to attenuated inflammation. (a) C57Bl/6 mice received three 5d cycles of 5% DSS challenges followed by a brief 2-3 d recovery. Animals received either the Sirt1 inhibitor EX-527 (1 mg/kg/d i.p.) or DMSO vehicle control (n=18). (b) Limited weight loss was noted in EX-527 treated mice. (c) Spleen sizes appeared slightly enlarged in the control DMSO group. (d) EX-527 treated mice had less rectal bleeding. (e–g): Upon histologic analysis, control animals demonstrate features of severe colitis including (e) marked crypt architectural distortion with neutrophilic infiltration of the lamina propria, crypt epithelium (“cryptitis”), and glandular lumina (“crypt abscess”). Inflammatory changes were ameliorated with addition of a Sirt1 inhibitor (EX-527). (f): Magnification of area indicated by dashed frame in DMSO treatement group colon specimen from (e). (g) Pooled data from blinded histologic analysis suggest that Sirt1 inhibitor treated animals had a lower degree of inflammation, intraepithelial lymphocytes (IEL), and inflammatory activity. H&E staining; scale bar indicates 100 μm. (h) Flow cytometry showing decreased CD11b+Gr1hi granulocytes and monocytes in EX-527 recipients (n=10). (i) Trend towards positive correlation between CD11b+Gr1hi cells and weight loss.
Figure 10
Figure 10
Sirt1 inhibition promotes iTreg formation, and does not affect IL–6 and IL–17 production during dextran sodium sulfate colitis. (a) Sirt1 inhibitor treated mice exhibited a higher Foxp3+Treg among splenocytes, which divided better (Ki-67 expression, right panel). (b, c) Elisa showing IL-6 (b) and IL-17 (c) levels in sera, ileum, and mesenteric lymph nodes (mLN) from experiments in Figure 6. Data were normalized by square root calculation, as indicated.

References

    1. Macdonald TT, Monteleone G. Immunity, inflammation, and allergy in the gut. Science. 2005;307(5717):1920–1925. - PubMed
    1. Izcue A, Coombes JL, Powrie F. Regulatory lymphocytes and intestinal inflammation. Annual review of immunology. 2009;27:313–338. - PubMed
    1. Himmel ME, Yao Y, Orban PC, Steiner TS, Levings MK. Regulatory T-cell therapy for inflammatory bowel disease: more questions than answers. Immunology. 2012;136(2):115–122. - PMC - PubMed
    1. Curotto de Lafaille MA, Lafaille JJ. Natural and adaptive foxp3+ regulatory T cells: more of the same or a division of labor? Immunity. 2009;30(5):626–635. - PubMed
    1. Hori S, Nomura T, Sakaguchi S. Control of regulatory T cell development by the transcription factor Foxp3. Science. 2003;299(5609):1057–1061. - PubMed

Publication types

MeSH terms