. 2014 May;82(5):1801-12.
doi: 10.1128/IAI.01431-13. Epub 2014 Feb 18.

Role of F1C fimbriae, flagella, and secreted bacterial components in the inhibitory effect of probiotic Escherichia coli Nissle 1917 on atypical enteropathogenic E. coli infection

Affiliations

Role of F1C fimbriae, flagella, and secreted bacterial components in the inhibitory effect of probiotic Escherichia coli Nissle 1917 on atypical enteropathogenic E. coli infection

Sylvia Kleta et al. Infect Immun. 2014 May.

Abstract

Enteropathogenic Escherichia coli (EPEC) is recognized as an important intestinal pathogen that frequently causes acute and persistent diarrhea in humans and animals. The use of probiotic bacteria to prevent diarrhea is gaining increasing interest. The probiotic E. coli strain Nissle 1917 (EcN) is known to be effective in the treatment of several gastrointestinal disorders. While both in vitro and in vivo studies have described strong inhibitory effects of EcN on enteropathogenic bacteria, including pathogenic E. coli, the underlying molecular mechanisms remain largely unknown. In this study, we examined the inhibitory effect of EcN on infections of porcine intestinal epithelial cells with atypical enteropathogenic E. coli (aEPEC) with respect to single infection steps, including adhesion, microcolony formation, and the attaching and effacing phenotype. We show that EcN drastically reduced the infection efficiencies of aEPEC by inhibiting bacterial adhesion and growth of microcolonies, but not the attaching and effacing of adherent bacteria. The inhibitory effect correlated with EcN adhesion capacities and was predominantly mediated by F1C fimbriae, but also by H1 flagella, which served as bridges between EcN cells. Furthermore, EcN seemed to interfere with the initial adhesion of aEPEC to host cells by secretion of inhibitory components. These components do not appear to be specific to EcN, but we propose that the strong adhesion capacities enable EcN to secrete sufficient local concentrations of the inhibitory factors. The results of this study are consistent with a mode of action whereby EcN inhibits secretion of virulence-associated proteins of EPEC, but not their expression.


Figures

FIG 1
FIG 1
aEPEC infection after preincubation with EcN. IPEC-J2 cells were preincubated with EcN, IMT13962, and MG1655 for 2 h, followed by aEPEC infection for 6 h. Numbers of adherent aEPEC bacteria were determined by serial dilutions of cell lysates. Shown are relative infection rates compared to aEPEC monoinfection (set as 100%) as mean values and standard deviations (SD) of at least 3 independent tests in duplicate wells. *, P < 0.0001 compared to monoinfection.
FIG 2
FIG 2
Effect of EcN on aEPEC microcolony formation. IPEC-J2 cells were preincubated with or without EcN for 2 h, followed by aEPEC infection for 6 h. Nonadherent bacteria were removed by washing. The cells and adherent bacteria were fixed and stained, and images were taken by confocal laser scanning microscopy. (A) aEPEC monoinfection. (B) EcN preincubation. Scale bars = 10 μm. aEPEC P2005/03 bacteria were stained using primary anti-O108 antisera and secondary anti-rabbit-IgG–TRITC antibodies (red), actin was stained with FITC phalloidin (green), and cell nuclei and bacteria were stained with propidium iodide (blue).
FIG 3
FIG 3
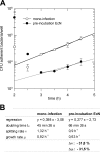
Growth kinetics of adherent aEPEC on epithelial cells. IPEC-J2 cells were preincubated with EcN for 2 h, followed by aEPEC infection for 4.5 h. Numbers of adherent aEPEC bacteria were determined by plating serial dilutions of cell lysates on agar plates every 30 min beginning 2 h after aEPEC infection. aEPEC was selectable due to tetracycline resistance. (A) Adherent aEPEC bacteria as mean values ± SD of 2 separate experiments in duplicate wells. (B) Regression and growth parameters. Calculations were as follows: td = t/n, where t is the time of determination and n is the number of divisions; n = (log N − log N0)/log2, where N is the number of bacteria after n divisions and N0 is the number of bacteria at the beginning of the experiment; ν = n/t; μ = ln2/td.
FIG 4
FIG 4
Adhesion of EcN to IPEC-J2 cells. EcN, IMT13962, and MG1655 were incubated with IPEC-J2 cells for 2 h in 12-well plates (2.6 × 10⁵ epithelial cells/well). Nonadherent bacteria were removed by washing, and numbers of adherent bacteria were determined by plating serial dilutions of cell lysates on agar plates. The data are given as mean values and SD of three separate experiments in duplicate wells. *, P < 0.05 compared to EcN.
FIG 5
FIG 5
Roles of F1C and type 1 fimbriae in adhesion of EcN and in aEPEC infection. For adhesion, the EcN wild type and mutants were incubated on IPEC-J2 cells for 2 h. For aEPEC infection, IPEC-J2 cells were first incubated with the EcN wild type and mutants for 2 h, followed by aEPEC infection for 6 h. IPEC-J2 cells were washed, and the numbers of adherent bacteria were determined by plating serial dilutions of cell lysates on agar plates. The data are given as relative adhesion rates compared to EcN or as infection rates in relation to monoinfection, respectively, as mean values and SD of three separate experiments in duplicate wells. **, P < 0.001, and *, P < 0.05 compared to EcN adhesion or aEPEC monoinfection, respectively.
FIG 6
FIG 6
(A) Scanning electron micrograph of IMT13962(pCosF1C6) on IPEC-J2. The F1C fimbria-negative E. coli control strain IMT13962 was complemented with the cosmid pCosF1C6 carrying the foc operon for production of F1C fimbriae. The strain was incubated with IPEC-J2 cells for 4 h, and images of bacteria on cells were taken by scanning electron microscopy. IMT13962(pCosF1C6) is shown to express F1C fimbriae. Scale bar = 1 μm. (B) Adhesion of IMT13962(pCosF1C6) and UPEC RZ525 to IPEC-J2 cells and effects on aEPEC infection. For adhesion, strains were incubated on IPEC-J2 cells for 2 h. For aEPEC infection, IPEC-J2 cells were first incubated with IMT13962 or RZ525 for 2 h, followed by aEPEC infection for 6 h. The IPEC-J2 cells were washed, and numbers of adherent bacteria were determined by plating serial dilutions of cell lysates on agar plates. The data are given as relative adhesion rates compared to EcN or as rates in relation to monoinfection, respectively, as mean values and SD of three separate experiments in duplicate wells. *, P < 0.05 compared to EcN adhesion or aEPEC monoinfection, respectively.
FIG 7
FIG 7
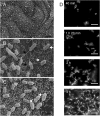
Scanning electron micrographs and fluorescence microscopy of EcN and EcN ΔfliA on IPEC-J2 cells. (A and B) EcN homogeneously adhered to IPEC-J2 cells via F1C fimbriae (white arrows) and formed a filamentous network via flagella (black arrows). (C) EcN ΔfliA did not express flagella and did not form a filamentous network but still adhered to IPEC-J2 cells via F1C fimbriae. Adhesion assays were performed for 4 h. Scale bars = 10 μm (A) and 1 μm (B and C). (D) Expression of flagella by EcN on IPEC-J2 cells. IPEC-J2 cells were incubated with EcN over a period of 4 h. At the indicated time points, cells and bacteria were fixed and flagella were stained by polyclonal anti-H1 antibodies and by secondary anti-rabbit IgG FITC-labeled antibodies. Images were taken by epifluorescence microscopy. Scale bar = 10 μm. Note that the EcN wild type expressed flagella depending on the incubation time on epithelial cells.
FIG 8
FIG 8
Role of flagella in adhesion of EcN to IPEC-J2 and in aEPEC infection. The EcN wild type, EcN ΔfliA, and EcN ΔfliA + fliA were incubated with IPEC-J2 cells for 2 h. For aEPEC infection, IPEC-J2 cells were first incubated with the EcN wild type, EcN ΔfliA, and EcN ΔfliA + fliA for 2 h, followed by aEPEC infection for 6 h. The IPEC-J2 cells were washed, and the numbers of adherent bacteria were determined by plating serial dilutions of cell lysates on agar plates. The data are given as relative adhesion rates compared to EcN or as rates in relation to monoinfection, respectively, as mean values and SD of at least three separate experiments in triplicate wells. *, P < 0.001 compared to EcN adhesion or aEPEC monoinfection.
FIG 9
FIG 9
Infection efficiencies of aEPEC P2005/03 on IPEC-J2 in pre- and coincubation experiments with bacterial supernatants. Infection was performed at an MOI of 100 for 6 h. IPEC-J2 cells were preincubated for 2 h or coincubated with bacterial supernatants. The data are given in relation to monoinfection as mean values and SD of three separate experiments in duplicate wells. *, P < 0.01 compared to monoinfection.
FIG 10
FIG 10
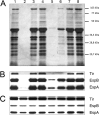
Detection of proteins expressed in and secreted by EPEC E2348/69. EPEC E2348/69 bacteria were grown to an OD600 of 1.0 in pure cell culture medium (lanes 1), in undiluted or 4:1- or 1:1-diluted supernatants of EcN (lanes 2, 3, and 4, respectively), or in undiluted supernatant of EcN with corrected pH (lanes 5), as well as in undiluted or 4:1- or 1:1-diluted supernatants of MG1655 (lanes 6, 7, and 8, respectively). (A and B) E2348/69-secreted proteins were extracted by TCA precipitation, concentrated 1,000-fold, and analyzed by SDS-PAGE, followed by silver staining (A) or Western blotting (B). (C) Intracellular proteins were detected by SDS-PAGE, followed by Western blotting. Western blotting included detection of EspA, EspB, or Tir. The amounts of loaded proteins corresponded to the amounts of secreted proteins in 10 ml bacterial culture at an OD600 of 1.0 for silver staining (A) and 3 ml for Western blot analysis (B), and the amounts of intracellular proteins corresponded to approximately 2.5 × 10⁷ E2348/69 bacteria each (C).

Similar articles

Cited by

References

    1. Bertschinger HU, Fairbrother JM. 1999. Escherichia coli infections, p 431–468 In Straw BE, D'Allaire S, Mengeling WL, Taylor DJ. (ed), Diseases of swine, 8th ed. Blackwell Science, Oxford, United Kingdom
    1. Zhu C, Harel J, Jacques M, Desautels C, Donnenberg MS, Beaudry M, Fairbrother JM. 1994. Virulence properties and attaching-effacing activity of Escherichia coli O45 from swine postweaning diarrhea. Infect. Immun. 62:4153–4159 - PMC - PubMed
    1. Clarke SC. 2001. Diarrhoeagenic Escherichia coli—an emerging problem? Diagn. Microbiol. Infect. Dis. 41:93–98. 10.1016/S0732-8893(01)00303-0 - DOI - PubMed
    1. Nataro JP, Kaper JB. 1998. Diarrheagenic Escherichia coli. Clin. Microbiol. Rev. 11:142–201 - PMC - PubMed
    1. Ochoa TJ, Barletta F, Contreras C, Mercado E. 2008. New insights into the epidemiology of enteropathogenic Escherichia coli infection. Trans. R. Soc. Trop. Med. Hyg. 102:852–856. 10.1016/j.trstmh.2008.03.017 - DOI - PMC - PubMed

Publication types

MeSH terms

Substances

LinkOut - more resources