. 2014 Apr;34(8):1521-34.
doi: 10.1128/MCB.00960-13. Epub 2014 Feb 18.

A saccharomyces cerevisiae RNase H2 interaction network functions to suppress genome instability

Affiliations

A saccharomyces cerevisiae RNase H2 interaction network functions to suppress genome instability

Stephanie Allen et al. Mol Cell Biol. 2014 Apr.

Abstract

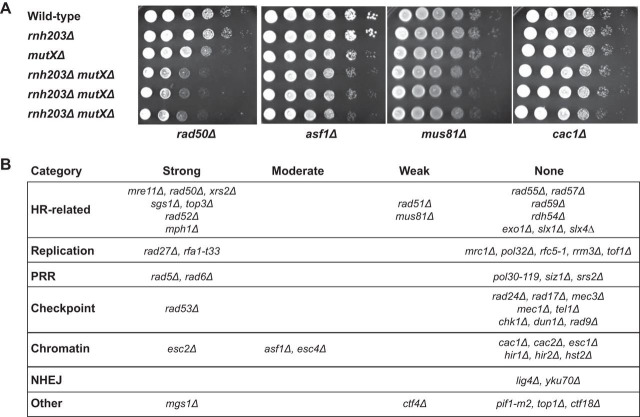
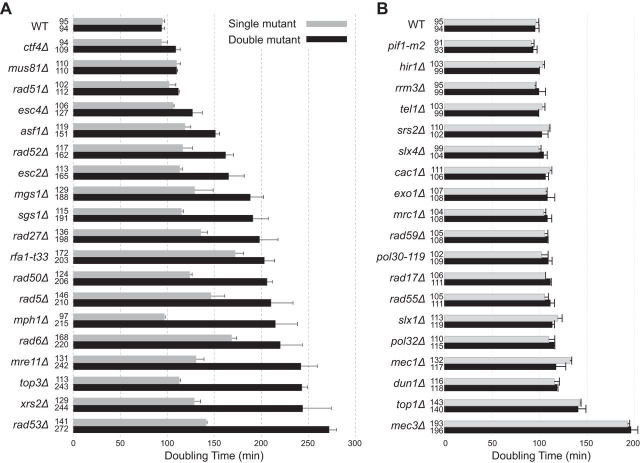
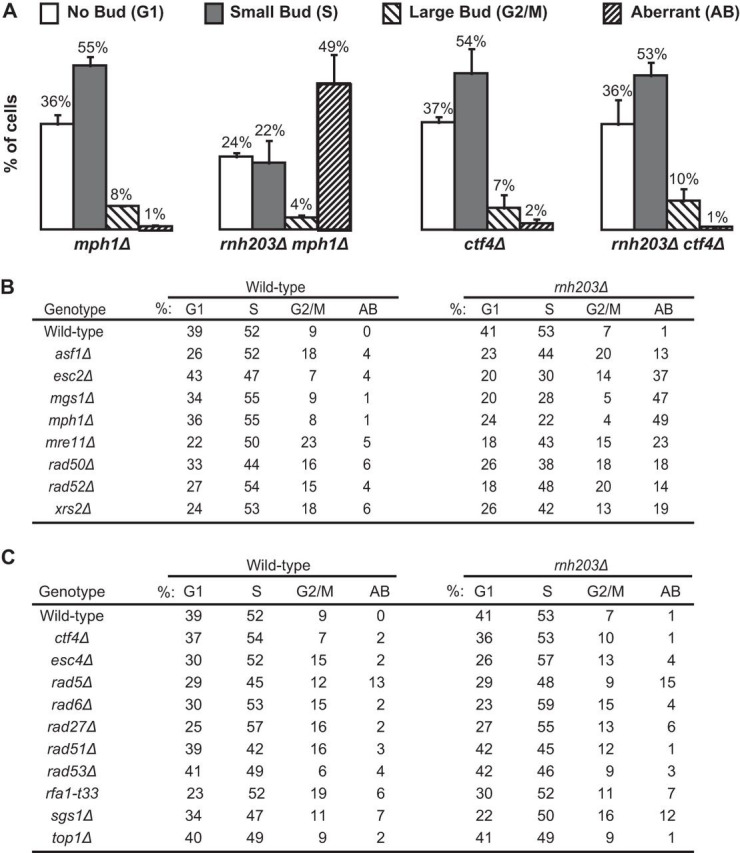
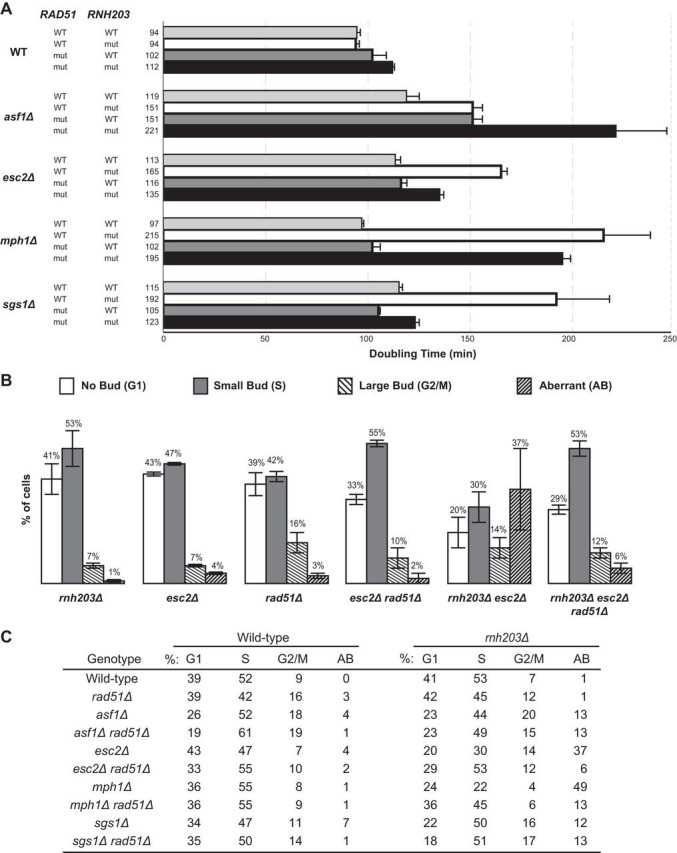
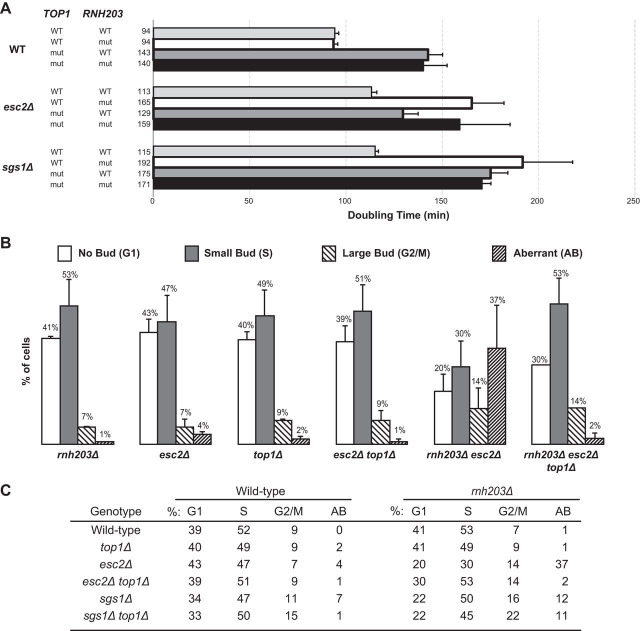
Errors during DNA replication are one likely cause of gross chromosomal rearrangements (GCRs). Here, we analyze the role of RNase H2, which functions to process Okazaki fragments, degrade transcription intermediates, and repair misincorporated ribonucleotides, in preventing genome instability. The results demonstrate that rnh203 mutations result in a weak mutator phenotype and cause growth defects and synergistic increases in GCR rates when combined with mutations affecting other DNA metabolism pathways, including homologous recombination (HR), sister chromatid HR, resolution of branched HR intermediates, postreplication repair, sumoylation in response to DNA damage, and chromatin assembly. In some cases, a mutation in RAD51 or TOP1 suppressed the increased GCR rates and/or the growth defects of rnh203Δ double mutants. This analysis suggests that cells with RNase H2 defects have increased levels of DNA damage and depend on other pathways of DNA metabolism to overcome the deleterious effects of this DNA damage.


Figures

FIG 1
FIG 1
Growth spot analysis for detection of RNase H2 genetic interactions. (A) Cultures were diluted to either 1 × 10⁶ cells/ml or 1 × 10⁵ cells/ml, and then 2-μl amounts from 10-fold serial dilutions were spotted in each row. Strains were spotted onto each plate as follows: top row, wild type; second row, the rnh203Δ single mutant; third row, the query single mutants (mutations identified at the bottom are represented at the right by mutXΔ); fourth through sixth rows, independent isolates of the double mutants. (B) Summary of RNase H2 defect-dependent growth interactions observed when an RNase H2 defect was combined with each of the 53 listed mutations. NHEJ, nonhomologous end joining.
FIG 2
FIG 2
Cells lacking RNase H2 depend on different DNA metabolism genes for normal growth. The growth rates measured for the indicated single and double mutants are presented, along with error bars indicating the standard deviations. (A) Cases in which an RNase H2 defect causes a decrease in the growth rate. (B) Cases in which an RNase H2 defect has no effect on the growth rate.
FIG 3
FIG 3
An RNase H2 defect can cause an accumulation of replication-dependent DNA damage that leads to an increase in an aberrant morphology phenotype. The budding index was measured to determine the percentage of cells in each phase of the cell cycle and the percentage of cells with an aberrant morphology phenotype. (A) Representative examples presented as histograms, with error bars indicating the standard deviations. (B, C) Summary of the budding index data for appropriate controls and mutant strains with an increase (B) and no increase (C) in aberrant morphology.
FIG 4
FIG 4
Defects in HR can suppress the slow growth phenotype and aberrant morphology phenotype of selected rnh203Δ double mutants. (A) Doubling times, with error bars indicating the standard deviations, are presented for the indicated single, double, and triple mutant strains. (B) The budding index was measured to determine the percentage of cells in each phase of the cell cycle and the percentage of cells with an aberrant morphology phenotype. Representative examples are presented as histograms, with error bars indicating the standard deviations. (C) Summary of the budding index data for mutant strains and controls.
FIG 5
FIG 5
Topoisomerase 1 defects can suppress the slow-growth phenotype and aberrant morphology phenotype of selected rnh203Δ double mutants. (A) Doubling times, with error bars indicating the standard deviations, are presented for the indicated single, double, and triple mutant strains. (B) The budding index was measured to determine the percentage of cells in each phase of the cell cycle and the percentage of cells with an aberrant morphology phenotype. Representative examples are presented as histograms, with error bars indicating the standard deviations. (C) Summary of the budding index data for mutant strains and controls.

References

    1. Waga S, Stillman B. 1994. Anatomy of a DNA replication fork revealed by reconstitution of SV40 DNA replication in vitro. Nature 369:207–212. - PubMed
    1. Zheng L, Shen B. 2011. Okazaki fragment maturation: nucleases take centre stage. J. Mol. Cell Biol. 3:23–30. 10.1093/jmcb/mjq048. - DOI - PMC - PubMed
    1. Bae SH, Bae KH, Kim JA, Seo YS. 2001. RPA governs endonuclease switching during processing of Okazaki fragments in eukaryotes. Nature 412:456–461. 10.1038/35086609. - DOI - PubMed
    1. MacNeill SA. 2001. DNA replication: partners in the Okazaki two-step. Curr. Biol. 11:R842–R844. 10.1016/S0960-9822(01)00500-0. - DOI - PubMed
    1. Huang L, Kim Y, Turchi JJ, Bambara RA. 1994. Structure-specific cleavage of the RNA primer from Okazaki fragments by calf thymus RNase HI. J. Biol. Chem. 269:25922–25927. - PubMed

Publication types

MeSH terms