. 2014 May;34(9):1564-75.
doi: 10.1128/MCB.00129-14. Epub 2014 Feb 18.

Thyroid hormone signaling in vivo requires a balance between coactivators and corepressors

Affiliations

Thyroid hormone signaling in vivo requires a balance between coactivators and corepressors

Kristen R Vella et al. Mol Cell Biol. 2014 May.

Abstract

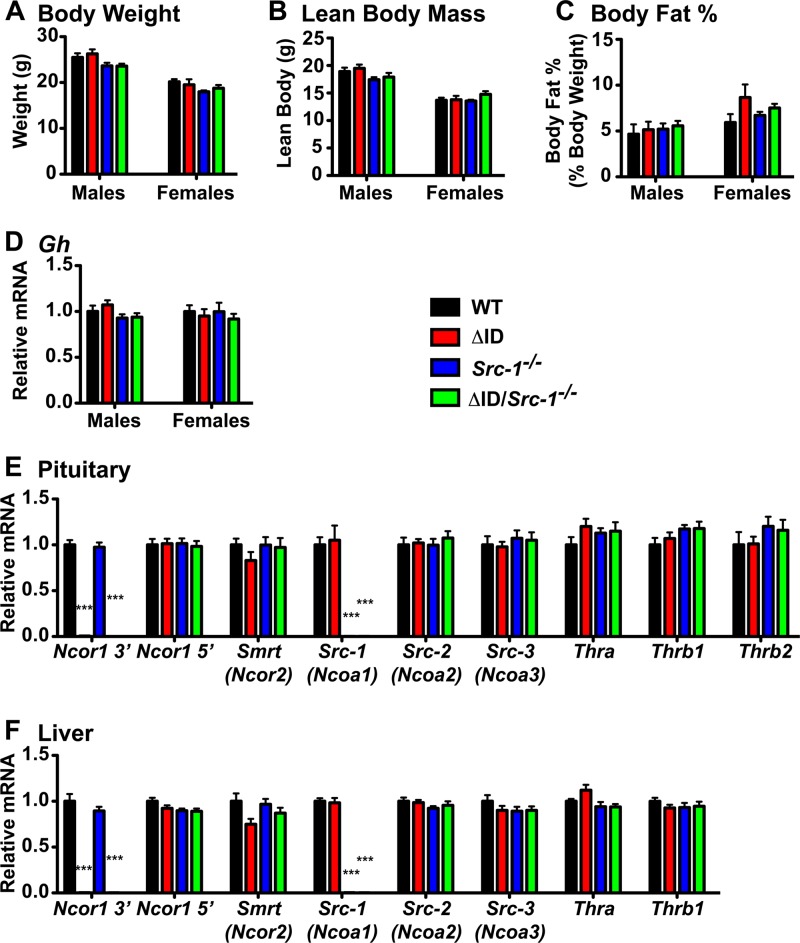
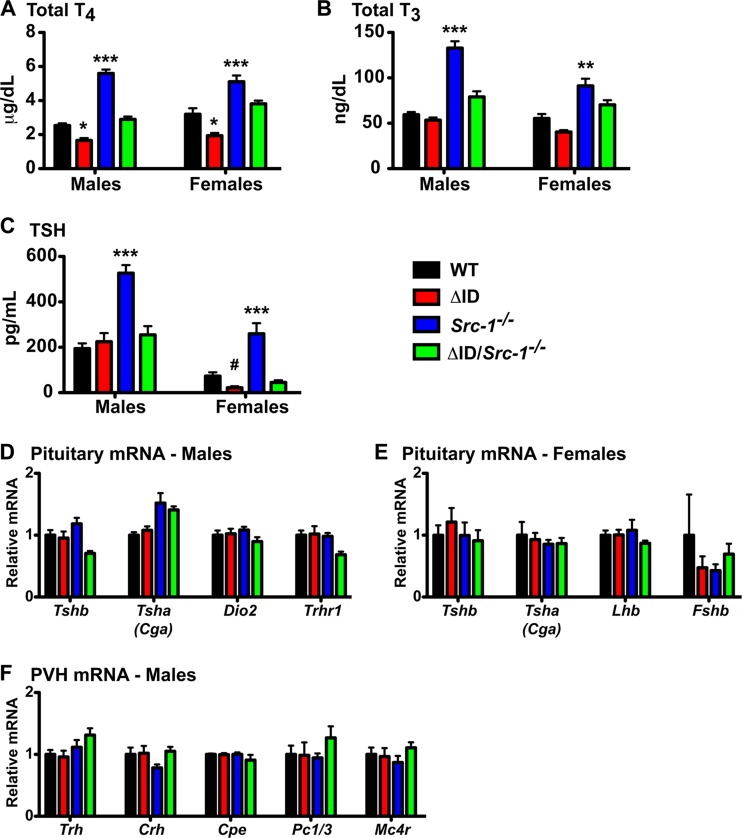
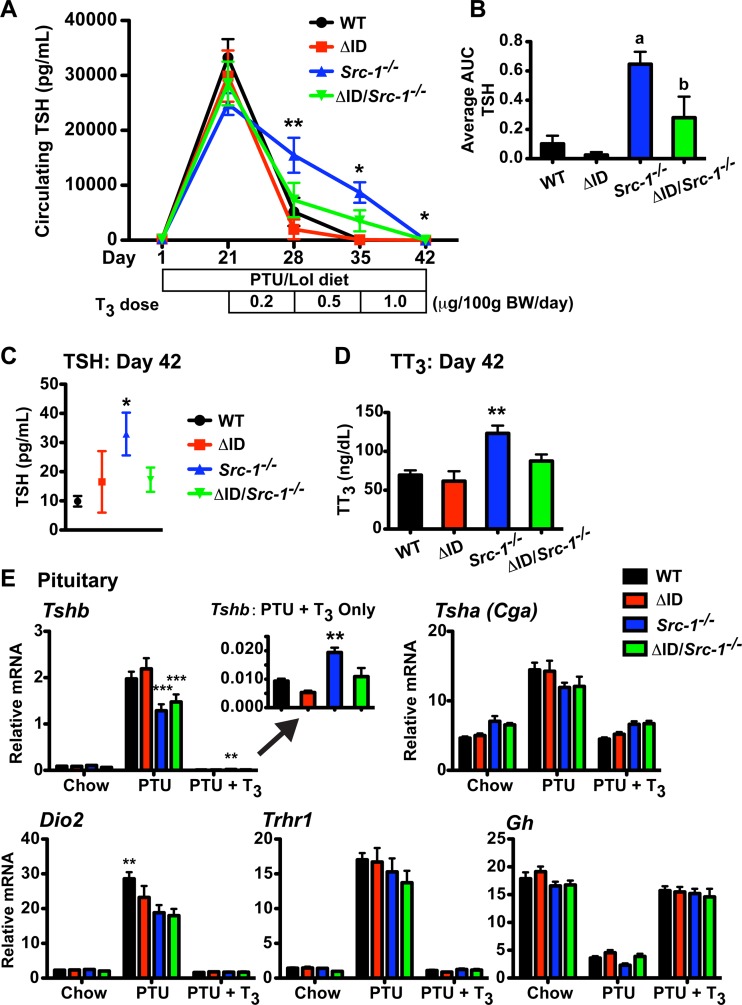
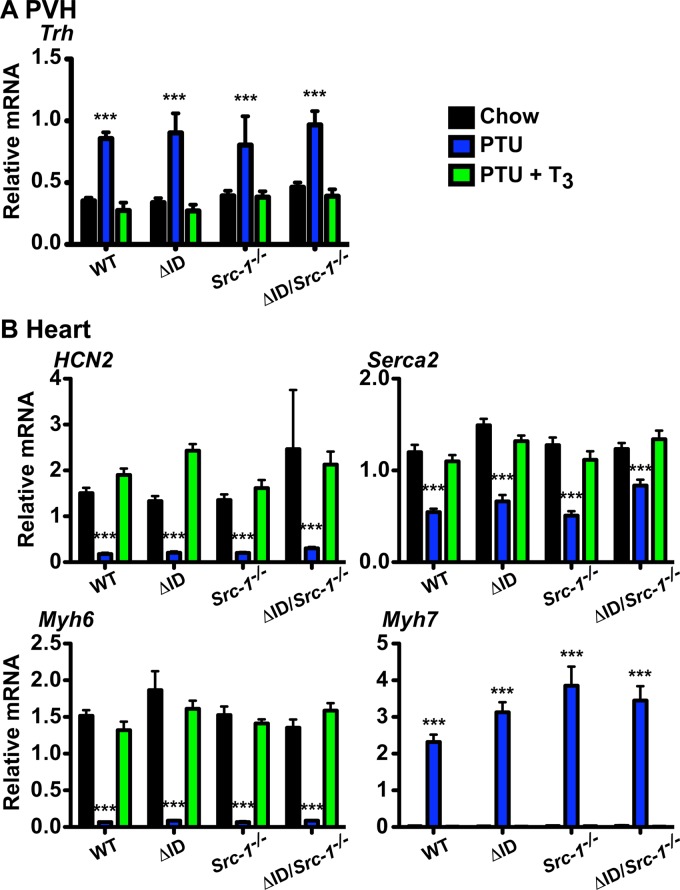
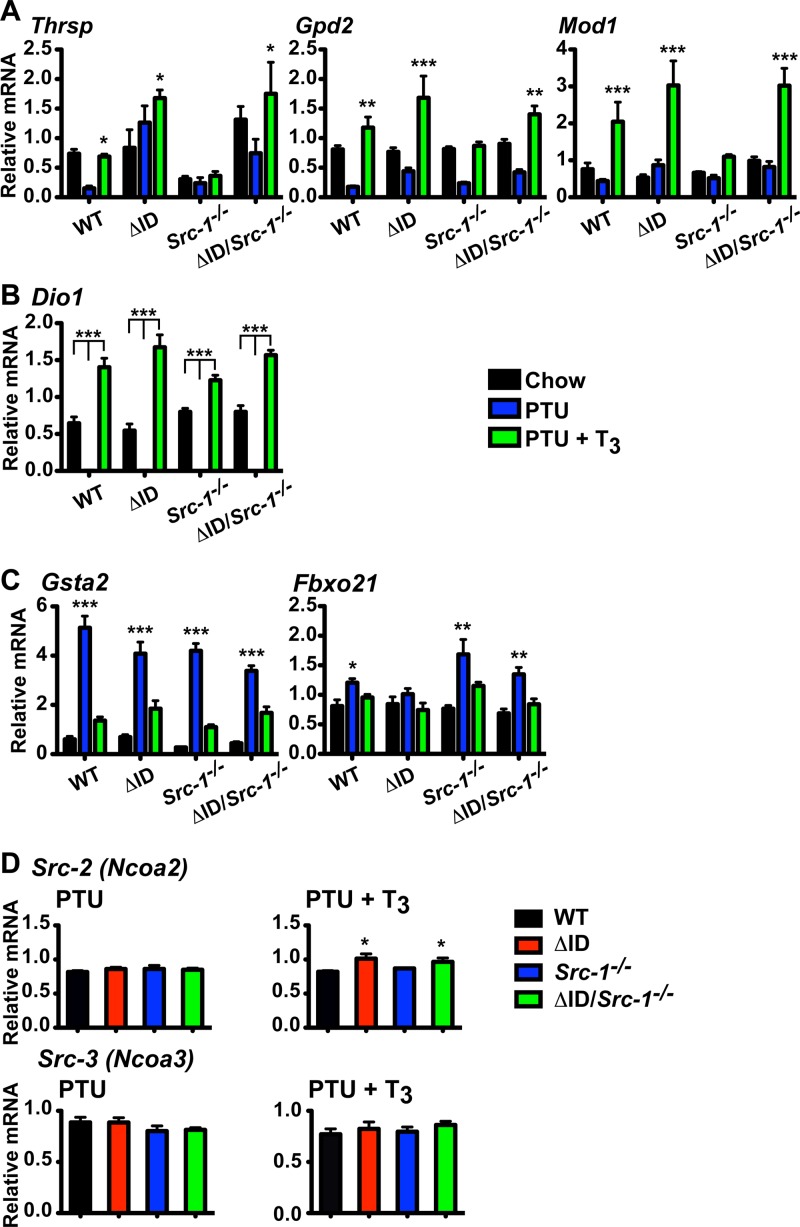
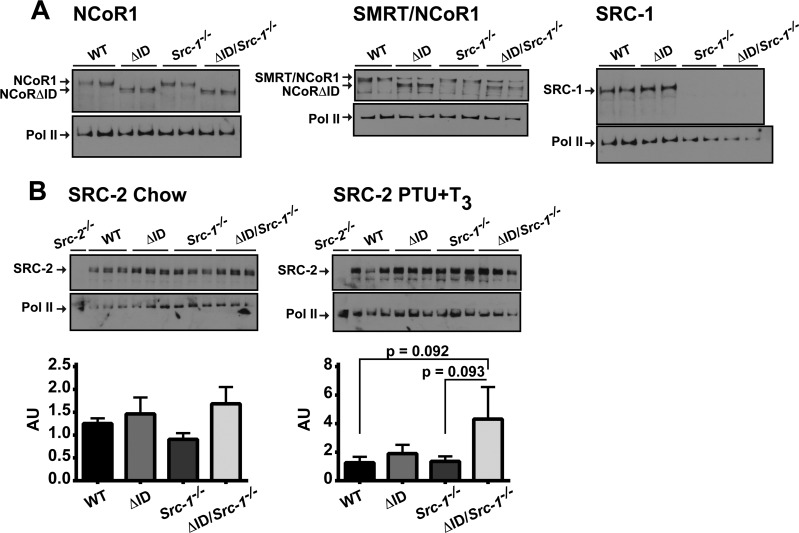
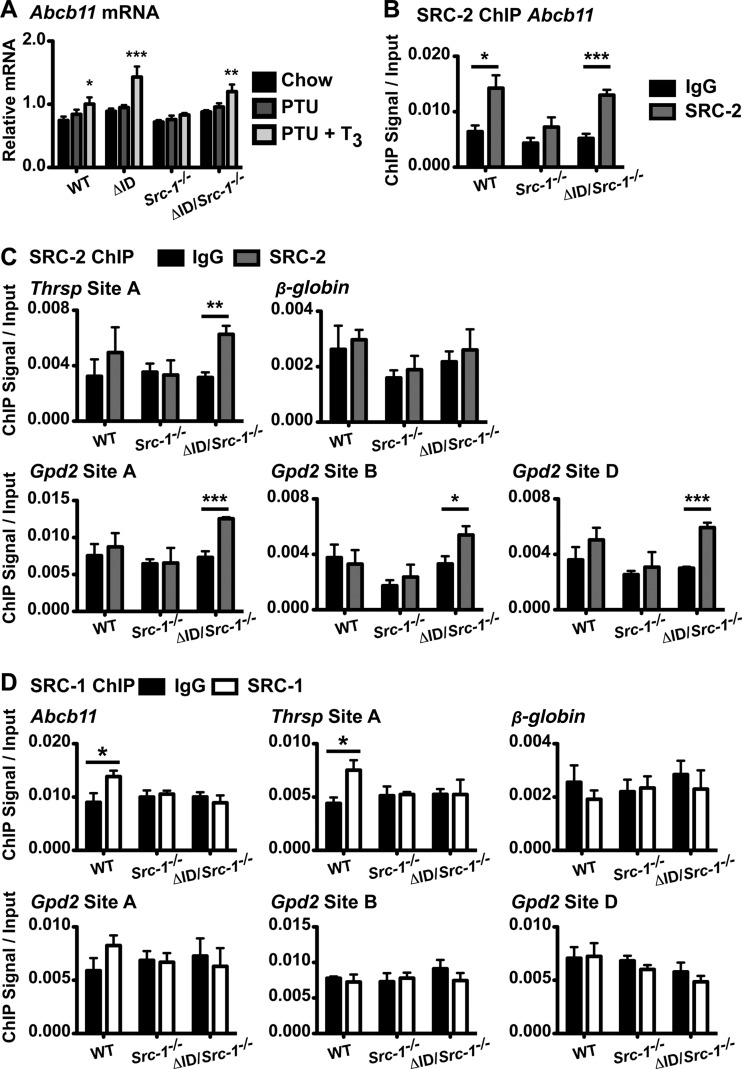
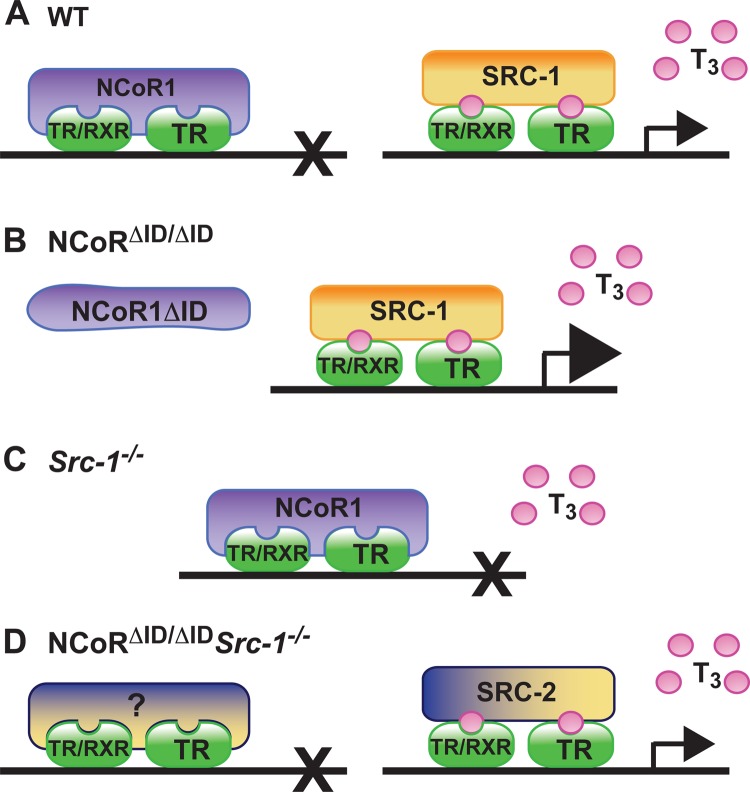
Resistance to thyroid hormone (RTH), a human syndrome, is characterized by high thyroid hormone (TH) and thyroid-stimulating hormone (TSH) levels. Mice with mutations in the thyroid hormone receptor beta (TRβ) gene that cannot bind steroid receptor coactivator 1 (SRC-1) and Src-1(-/-) mice both have phenotypes similar to that of RTH. Conversely, mice expressing a mutant nuclear corepressor 1 (Ncor1) allele that cannot interact with TRβ, termed NCoRΔID, have low TH levels and normal TSH. We hypothesized that Src-1(-/-) mice have RTH due to unopposed corepressor action. To test this, we crossed NCoRΔID and Src-1(-/-) mice to create mice deficient for coregulator action in all cell types. Remarkably, NCoR(ΔID/ΔID) Src-1(-/-) mice have normal TH and TSH levels and are triiodothryonine (T(3)) sensitive at the level of the pituitary. Although absence of SRC-1 prevented T(3) activation of key hepatic gene targets, NCoR(ΔID/ΔID) Src-1(-/-) mice reacquired hepatic T(3) sensitivity. Using in vivo chromatin immunoprecipitation assays (ChIP) for the related coactivator SRC-2, we found enhanced SRC-2 recruitment to TR-binding regions of genes in NCoR(ΔID/ΔID) Src-1(-/-) mice, suggesting that SRC-2 is responsible for T(3) sensitivity in the absence of NCoR1 and SRC-1. Thus, T(3) targets require a critical balance between NCoR1 and SRC-1. Furthermore, replacement of NCoR1 with NCoRΔID corrects RTH in Src-1(-/-) mice through increased SRC-2 recruitment to T(3) target genes.


Figures

FIG 1
FIG 1
Deletion of Src-1 and mutation of NCoR1 does not affect mRNA expression of other coregulators and thyroid hormone receptors. (A) Body weights of WT, NCoRΔID/ΔID (ΔID), Src-1−/−, and NCoRΔID/ΔID Src-1−/− (ΔID/Src-1−/−) mice at 9 weeks of age were measured in male and female mice. (B and C) Lean body mass (B) and body fat percentage (C) were measured in male and female mice at 9 weeks of age by EchoMRI. (D) Gh mRNA was measured by qPCR in the pituitaries of male and female mice, normalized to 18S rRNA, and expressed relative to the WT group. (A to D) Data are presented as means and SEM (n = 7 to 13 per genotype). Significance was tested with 1-way ANOVA. (E) In pituitaries from male WT, ΔID, Src-1−/−, and ΔID/Src-1−/− mice, qPCR was performed to quantify mRNA of the 3′ region of NCoR1 (Ncor1 3′), the 5′ region of NCoR1 (Ncor1 5′), SMRT (Ncor2), SRC-1 (Ncoa1), SRC-2 (Ncoa2), SRC-3 (Ncoa3), and thyroid hormone receptors (Thra, Thrb1, and Thrb2). (F) To quantify mRNA in the livers of the same male mice, qPCR was used to analyze the 3′ region of NCoR1 (Ncor1 3′), the 5′ region of NCoR1 (Ncor1 5′), SMRT (Ncor2), SRC-1 (Ncoa1), SRC-2 (Ncoa2), SRC-3 (Ncoa3), and thyroid hormone receptors (Thra and Thrb1). (E and F) mRNA was normalized to 18S rRNA and expressed relative to the WT group (n = 7 to 13 per genotype). Significance was tested by 1-way ANOVA with Tukey's multiple-comparison post hoc test. For Ncor1 3′, ***, P < 0.001 versus WT and Src-1−/− mice. For Src-1, ***, P < 0.001 versus WT and ΔID mice.
FIG 2
FIG 2
Disruption of the interaction between the TR and NCoR1 in Src-1−/− mice normalizes TH and TSH levels in male and female mice. Plasma total T4 (A), total T3 (B), and circulating TSH (C) were measured in male and female WT, NCoRΔID/ΔID (ΔID), Src-1−/−, and NCoRΔID/ΔID Src-1−/− (ΔID/Src-1−/−) mice. (A to C) n = 6 to 12. The data are presented as means and SEM. Significance was tested by 1-way ANOVA with Tukey's multiple-comparison post hoc test. *, P < 0.05 versus all; **, P < 0.01 versus all; ***, P < 0.001 versus all; #, P < 0.05 versus WT and Src-1−/−. (D) In pituitaries from male mice, mRNA expression was analyzed by qPCR for TSH subunits Tshb and Tsha (Cga), the type II deiodinase (Dio2), and the TRH receptor (Trhr1). (E) In pituitaries from female mice, mRNA expression was analyzed by qPCR for TSH subunits Tshb and Tsha (Cga), luteinizing hormone (Lhb), and follicle-stimulating hormone (Fshb). (F) In male mice, the PVH was microdissected, and mRNA was quantified by qPCR for thyrotropin-releasing hormone (Trh), corticotropin-releasing hormone (Crh), carboxypeptidase E (Cpe), prohormone convertase 1/3 (Pc1/3), and melanocortin 4 receptor (Mc4r). (D to F) mRNA was normalized to 18S rRNA and expressed relative to the WT group (n = 6 to 12). The data are presented as means and SEM. Significance was tested with 1-way ANOVA.
FIG 3
FIG 3
NCoRΔID/ΔID Src-1−/− mice suppress plasma TSH similarly to WT mice in response to T3. (A) The plasma TSH concentration was repeatedly measured in WT, NCoRΔID/ΔID (ΔID), Src-1−/−, and NCoRΔID/ΔID Src-1−/− (ΔID/Src-1−/−) male mice after 21 days of a LoI/PTU diet and consecutive 7-day treatments with increasing concentrations of T3 (0.2, 0.5, and 1.0 μg/100 g BW/day; n = 7 or 8). The data are presented as means ± SEM and were analyzed by repeated-measures 2-way ANOVA with the Bonferroni post hoc test. *, P < 0.05 for Src-1−/− versus all; **, P < 0.01 for Src-1−/− versus all. (B) AUC of each mouse averaged by genotype (n = 7 or 8). The data are presented as means and SEM and were analyzed by 1-way ANOVA with Tukey's multiple-comparison post hoc test. a, P < 0.01 for Src-1−/− versus WT and ΔID; b, P < 0.05 for Src-1−/− versus ΔID/Src-1−/−. (C and D) Circulating TSH levels and TT3 levels at day 42 following 7 days of treatment with the largest dose of T3. (C) n = 7 or 8. The data are presented as means ± SEM and were analyzed by repeated-measures 2-way ANOVA with a Bonferroni post hoc test. *, P < 0.05 for Src-1−/− versus all. (D) n = 7 or 8. The data are presented as means and SEM and were analyzed by 1-way ANOVA with Tukey's multiple-comparison post hoc test. **, P < 0.01 for Src-1−/− versus all. (E) Analysis of mRNA expression of TH-responsive targets in the pituitary by qPCR in the indicated groups. Expression of Tshb, Tsha, Dio2, Trhr1, and Gh was normalized to 18S rRNA (n = 7 to 12). The inset highlights Tshb mRNA expression at day 42 following 7 days of treatment with the largest dose of T3. The data are presented as means and SEM and were analyzed by 2-way ANOVA with a Bonferroni post hoc test. **, P < 0.01 versus all; ***, P < 0.001 versus WT and ΔID.
FIG 4
FIG 4
Gene expression in the PVH and the heart. mRNA levels were measured by qPCR in WT, NCoRΔID/ΔID (ΔID), Src-1−/−, and NCoRΔID/ΔID Src-1−/− (ΔID/Src-1−/−) mice following 21 days of a LoI/PTU diet (PTU) and a LoI/PTU diet with T3 replacement for 21 days with increasing doses of T3 (PTU + T3) compared with the control (Chow). (A) Trh mRNA was measured in the PVH microdissected from mouse brain and was normalized to expression of 18S rRNA. (B) mRNA expression of known positive and negative TH targets in the heart. HCN2, Serca2, Myh6, and Myh7 were normalized to expression of cyclophilin. (A and B) n = 5 to 7. The data are presented as means and SEM and were analyzed by 2-way ANOVA with a Bonferroni post hoc test. ***, P < 0.001 versus chow and PTU + T3.
FIG 5
FIG 5
Loss of TR-NCoR1 interaction in Src-1−/− mice reestablishes the T3 response in some positive TH targets in the liver. mRNA levels were measured by qPCR in livers from WT, NCoRΔID/ΔID (ΔID), Src-1−/−, and NCoRΔID/ΔID Src-1−/− (ΔID/Src-1−/−) mice following 21 days of a LoI/PTU diet (PTU) and a LoI/PTU diet with T3 replacement for 21 days with increasing doses of T3 (PTU + T3) compared with the control (Chow). (A to C) All genes were normalized to 18S rRNA (n = 6 to 13). The data are presented as means and SEM and were analyzed by 2-way ANOVA with a Bonferroni post hoc test. (A) T3 response in positive TH targets Thrsp, Gpd2, and Mod1 was reestablished with the addition of NCoRΔID. *, P < 0.05 versus PTU; **, P < 0.01 versus PTU; ***, P < 0.001 versus PTU. (B) Positive TH target type I deiodinase (Dio1) is not affected by changes in NCoR1 or SRC-1. ***, P < 0.001. (C) Expression of negative TH targets Gsta2 and Fbxo21. *, P < 0.05 versus chow and PTU + T3; **, P < 0.01 versus chow and PTU + T3; ***, P < 0.001 versus chow and PTU + T3. (D) Responses of SRC-2 (Ncoa2) and SRC-3 (Ncoa3) mRNAs to changes in TH levels under PTU and PTU + T3 conditions. The data were normalized to 18S rRNA (n = 6 to 13). The data are presented as means and SEM and were analyzed by 1-way ANOVA with Tukey's multiple-comparison post hoc test. *, P < 0.05 versus chow.
FIG 6
FIG 6
Under PTU + T3 conditions, SRC-2 protein levels trend toward increased levels in NCoRΔID/ΔID Src-1−/− mice compared to WT and Src-1−/− mice. (A) Whole-cell protein extracts were isolated from the livers of male WT, NCoRΔID/ΔID (ΔID), Src-1−/−, and NCoRΔID/ΔID Src-1−/− (ΔID/Src-1−/−) mice and subjected to Western analysis with anti-NCoR1, SMRT/NCoR1, and SRC-1. The blots were stripped and reprobed with anti-RNA polymerase II (Pol II). (B) Western analysis of SRC-2 protein levels in the livers of all genotypes under chow and PTU + T3 conditions compared to RNA polymerase II. The blots were scanned and quantified with ImageJ and normalized to RNA polymerase II levels (1-way ANOVA, P < 0.05; Tukey's multiple-comparison post hoc test, ΔID/Src-1−/− versus WT, P = 0.092, and ΔID/Src-1−/− versus Src-1−/−, P = 0.093). Extracts from Src-2−/− mice were used to confirm SRC-2 antibody specificity.
FIG 7
FIG 7
SRC-2 binds to T3 target gene promoters in the absence of SRC-1 and NCoR1. (A) In livers from male WT, NCoRΔID/ΔID (ΔID), Src-1−/−, and NCoRΔID/ΔID Src-1−/− (ΔID/Src-1−/−) mice, mRNA levels were measured by qPCR following 21 days of a LoI/PTU diet (PTU) and a LoI/PTU diet with T3 replacement for 21 days with increasing doses of T3 (PTU + T3) compared with control (Chow). Expression of the SRC-2 target gene Abcb11 was normalized to the expression of 18S rRNA (n = 6 to 13). The data are presented as means and SEM and were analyzed by 2-way ANOVA with a Bonferroni post hoc test. Chow versus PTU + T3, *, P < 0.05; **, P < 0.01; ***, P < 0.001. (B) SRC-2 ChIP was validated by ChIP-qPCR analysis using an anti-SRC-2 antibody (SRC-2) versus IgG for the proximal promoter of the SRC-2 target gene Abcb11 on the chromatin from livers of WT, Src-1−/−, and ΔID/Src-1−/− mice under PTU + T3 conditions. (C) Using the same chromatin, SRC-2 ChIP-qPCR analysis was performed for a TRβ binding site (site A) upstream of the Thrsp promoter, three intragenic sites (sites A, B, and D) within the first intron of the T3 target gene Gpd2, and a site on the β-globin gene (Hbb1) that does not bind TRβ. (D) ChIP-qPCR analysis was performed using an anti-SRC-1 antibody (SRC-1) or IgG on the same chromatin from panels B and C for the proximal promoter of the SRC-2 target gene Abcb11; Thrsp site A; Gpd2 sites A, B, and D; and a site in the β-globin gene (Hbb1) that does not bind TRβ. (B to D) n = 4. The results are reported as fold enrichment (ChIP signal) normalized to the DNA input. The data are presented as means and SEM and were analyzed by unpaired t test for antibody versus IgG. *, P < 0.05; **, P < 0.01; ***, P < 0.001.
FIG 8
FIG 8
In peripheral tissues, the balance of corepressors and coactivators is most important in determining T3 sensitivity in the liver. (A) On classic positive T3 targets in WT mice, NCoR1 is recruited to nuclear receptor heterodimers (TR/RXR) or homodimers (TR/TR) in the absence of ligand, and transcription is repressed. In the presence of T3, NCoR1 is released, and SRC-1 is recruited to mediate transcriptional activity. (B) When NCoR1 is not readily available, as exemplified in NCoRΔID/ΔID mice, there is increased response to T3, suggesting that recruitment of SRC-1 is also increased. (C) In Src-1−/− mice, when SRC-1 is absent, genes do not respond to T3, which is consistent with decreased sensitivity and suggests prioritized recruitment of NCoR1. (D) Replacement of NCoR1 with NCoRΔID in Src-1−/− mice reestablishes hepatic T3 sensitivity. Our work here describes the increased binding of SRC-2 in the liver in the absence of both SRC-1 and NCoR1 under increased T3 conditions, suggesting a compensatory role for SRC-2. NCoR1, nuclear corepressor 1; NCoRΔID/ΔID, mice expressing NCoRΔID; NCoRΔID/ΔID Src-1−/−, mice expressing NCoRΔID and also null for SRC-1; RXR, retinoid X receptor; SRC-1, steroid receptor coactivator 1 (Ncoa1); Src-1−/−, SRC-1 knockout mice; SRC-2, steroid receptor coactivator 2 (Ncoa2); T3, triiodothryonine (thyroid hormone); TR, thyroid hormone receptor.

References

    1. Costa-e-Sousa RH, Hollenberg AN. 2012. Minireview: the neural regulation of the hypothalamic-pituitary-thyroid axis. Endocrinology 153:4128–4135. 10.1210/en.2012-1467 - DOI - PMC - PubMed
    1. Chiamolera MI, Wondisford FE. 2009. Minireview: thyrotropin-releasing hormone and the thyroid hormone feedback mechanism. Endocrinology 150:1091–1096. 10.1210/en.2008-1795 - DOI - PubMed
    1. Zhang J, Lazar MA. 2000. The mechanism of action of thyroid hormones. Annu. Rev. Physiol. 62:439–466. 10.1146/annurev.physiol.62.1.439 - DOI - PubMed
    1. Yen PM. 2001. Physiological and molecular basis of thyroid hormone action. Physiol. Rev. 81:1097–1142 - PubMed
    1. Cheng SY, Leonard JL, Davis PJ. 2010. Molecular aspects of thyroid hormone actions. Endocr. Rev. 31:139–170. 10.1210/er.2009-0007 - DOI - PMC - PubMed

Publication types

MeSH terms